Don’t forget that you can save 20% on our self-paced, live-online, and in-person GIS training through December 31st by using the discount code 20for20. Discount already applied to the Annual GIS Training License.
Population growth and decline are dynamic trends influenced by migration, urbanization, and regional economic changes. By leveraging ArcGIS Pro’s Hot Spot Analysis Tool, we can identify statistically significant patterns of population change across the United States, from sprawling urban areas to remote rural regions. This article explores the tool, its applications, and insights gained by examining population change data between 2018 and 2023.
What is the Hot Spot Analysis Tool?
The Hot Spot Analysis (Getis-Ord Gi) tool in ArcGIS Pro identifies spatial clusters of high and low values. Using statistical measures, it determines whether the observed clustering is significant or random. Hot spots indicate areas with significantly higher values (e.g., strong population growth), while cold spots highlight lower values or decline.
Key Parameters:
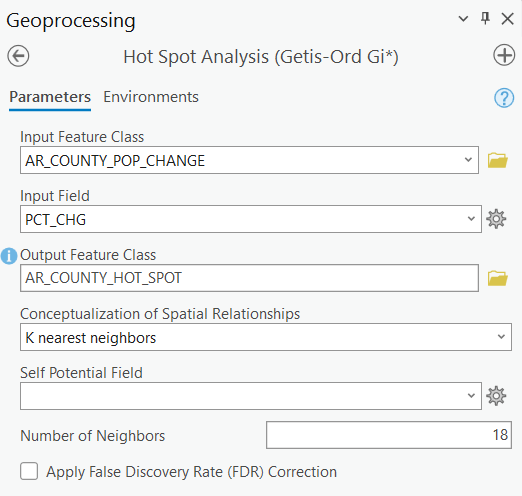
- Conceptualization of Spatial Relationships: Determines how features relate spatially. In this analysis we used K Nearest Neighbors for this parameter and specified 18 neighbors.
- Number of Neighbors: Controls the search area for patterns. We used 18 neighbors for this analysis.
- Field of Interest: The attribute field being analyzed (e.g., % Population Change).
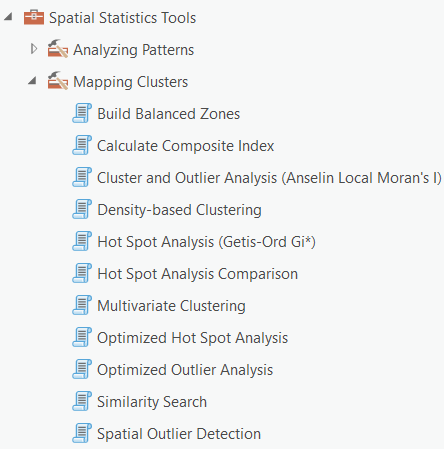
For nationwide analysis, “K Nearest Neighbors” with a sufficient neighbor count (e.g., 18) ensures broader spatial relationships are considered, ideal for tract-level population analysis. The Hot Spot Analysis tool can be found in the Geoprocessing pane under the Spatial Statistics Toolbox in the Mapping Clusters toolset.
Data Collection and Preparation
The data for this analysis was sourced from the U.S. Census Bureau using the American Community Survey (ACS) 5-Year Estimates for the years 2018 and 2023. To facilitate the extraction and preparation of this data, we utilized the powerful R programming environment along with the following key packages:
- tidycensus: A widely used package for accessing U.S. Census Bureau data directly from R. It simplifies pulling specific ACS datasets, including population estimates.
- tidyverse: A suite of R packages designed for data manipulation, transformation, and cleaning.
- sf: A package for handling spatial data in R, used for transforming and visualizing the geometries associated with census geographies.
Data Extraction Workflow
- Defining Geographic Resolution:
For this analysis, the geographic unit of interest was census tracts, which provide a detailed view of population changes at a sub-county level. Census tract data is ideal for identifying patterns of population growth or decline within cities, suburbs, and rural areas. - Using tidycensus to Retrieve Population Data:
The tidycensus package was used to pull population estimates (Table B01003 – Total Population) for both 2018 and 2023. - Transforming Data for Spatial Analysis:
The data was re-projected using sf into the Albers Equal Area projection (EPSG: 5070) to ensure consistency across the contiguous United States. For Alaska and Hawaii, we applied state-specific projections to align spatial data accurately. - Merging and Calculating Population Change:
Population data from 2018 and 2023 was then merged using the GEOID field (a unique identifier for census tracts). - Hot Spot Analysis Preparation:
The cleaned and transformed data was exported as shapefiles, which were then merged in ArcGIS Pro for the Hot Spot Analysis. The resulting dataset provided both absolute and percentage-based population change for census tracts across the United States.
Population Change Insights Across the U.S.
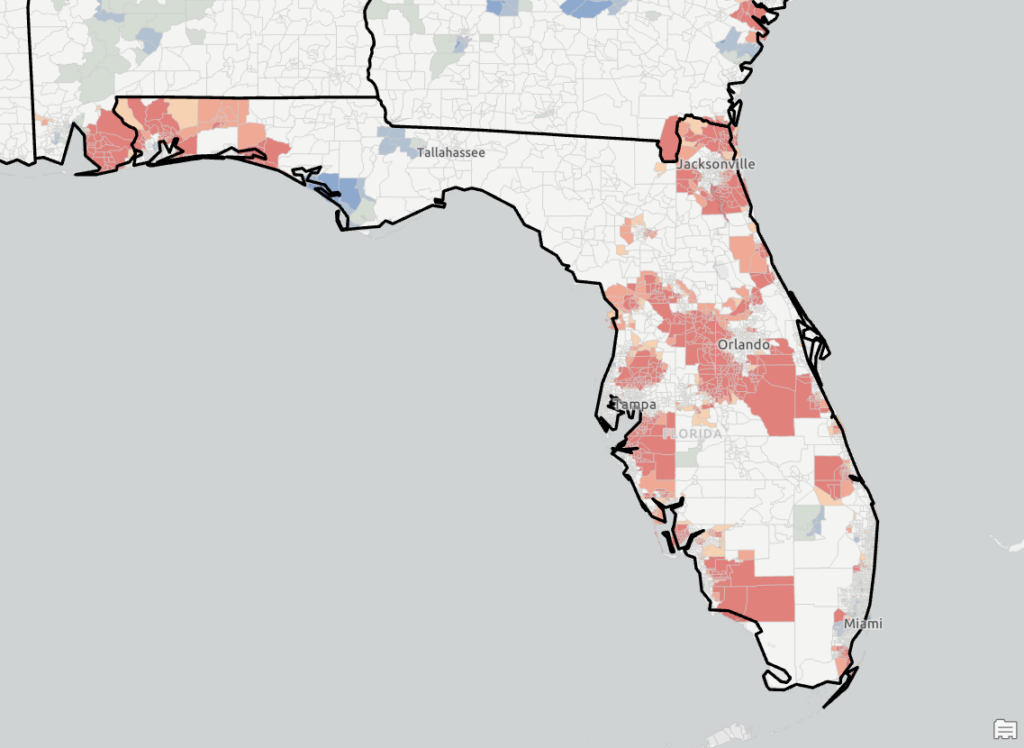
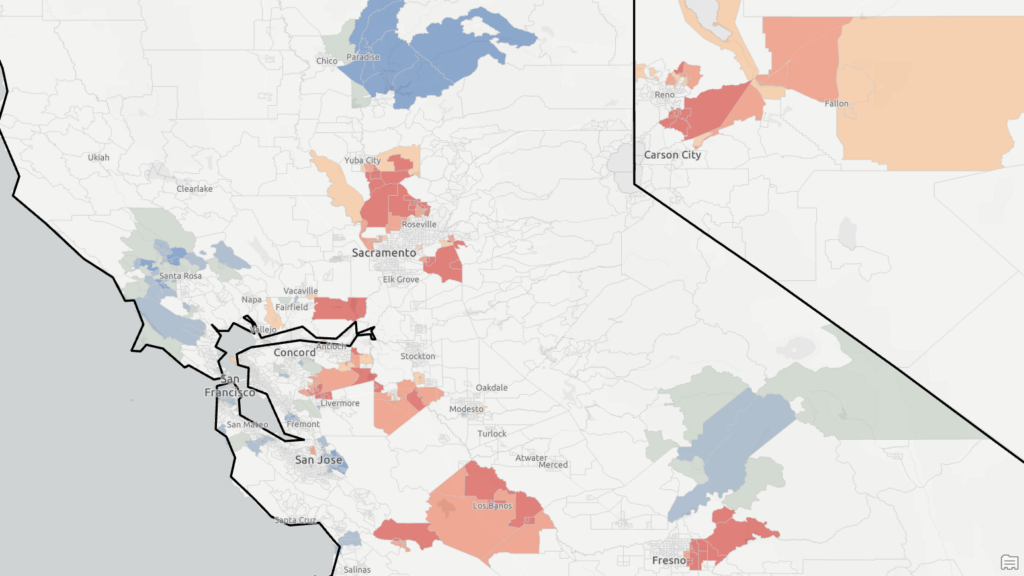
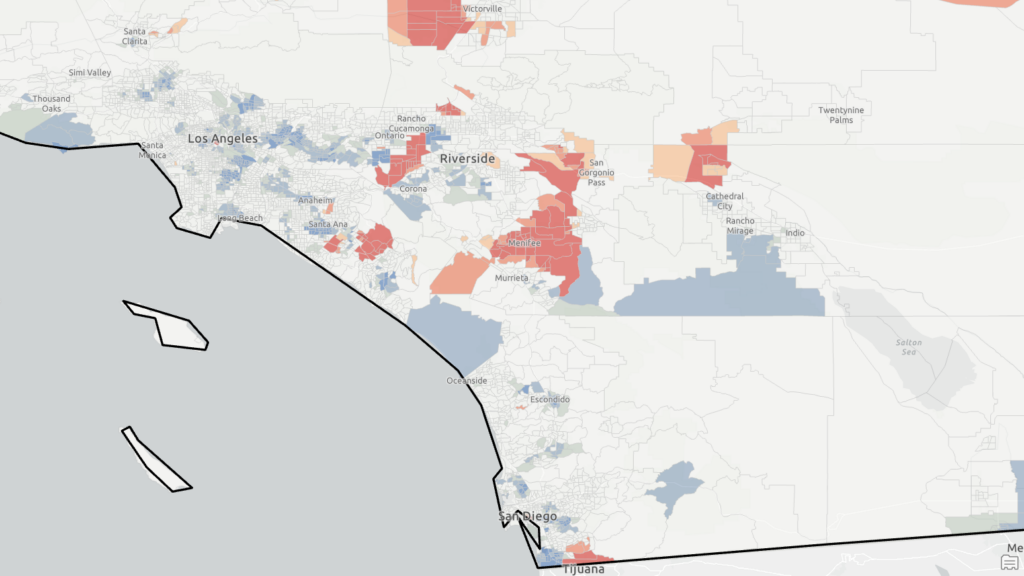
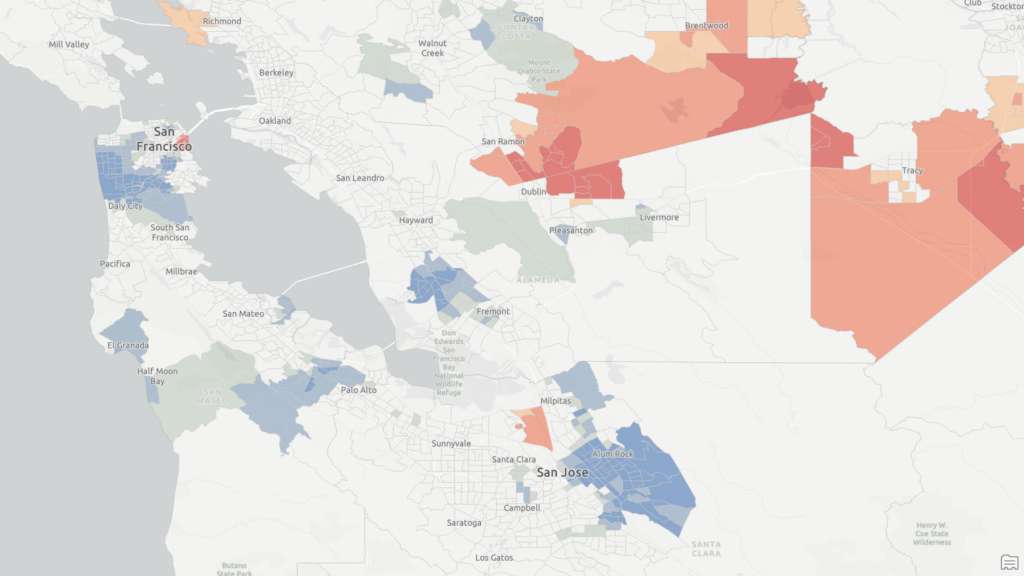
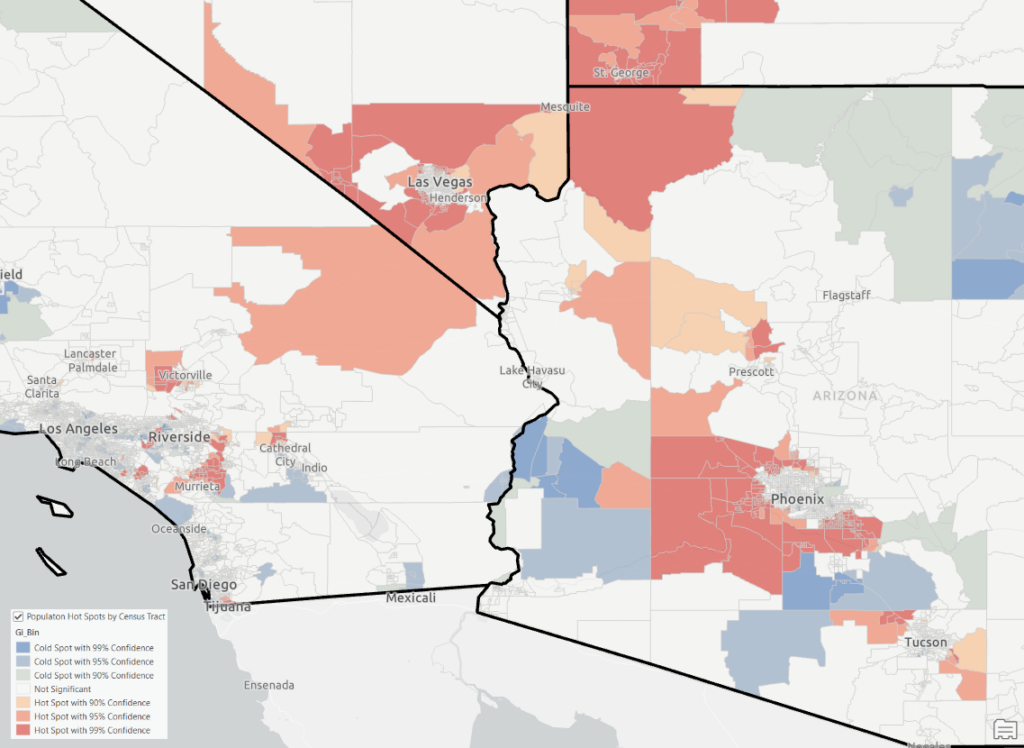
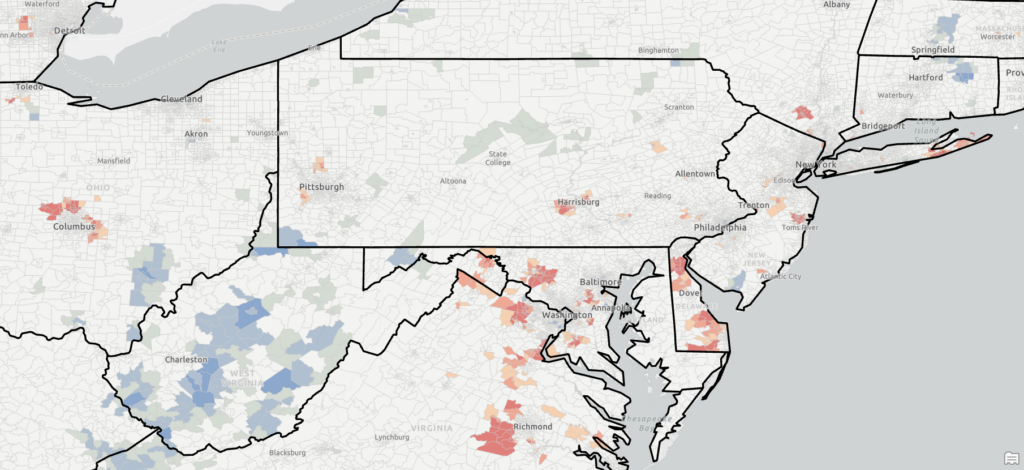
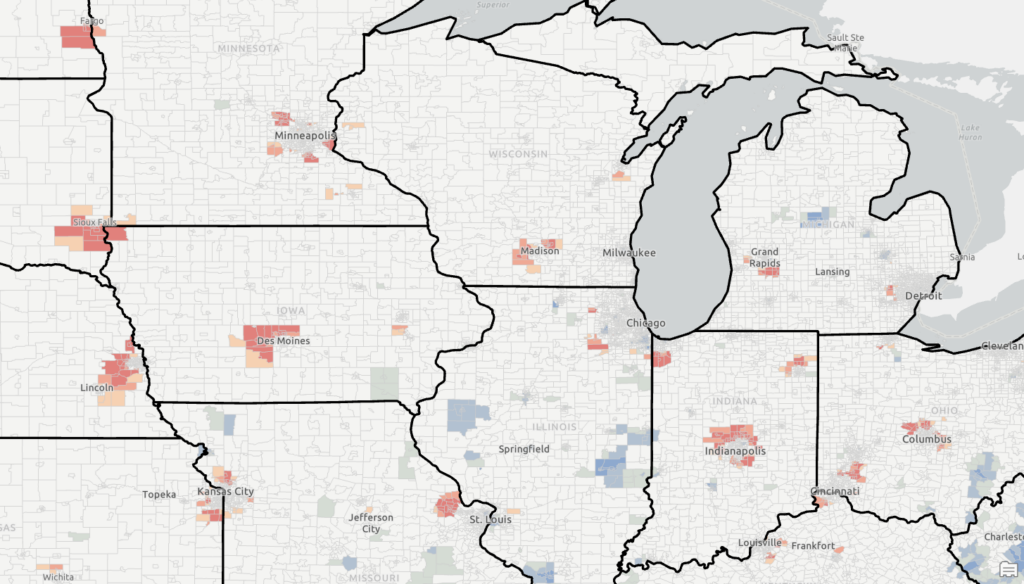
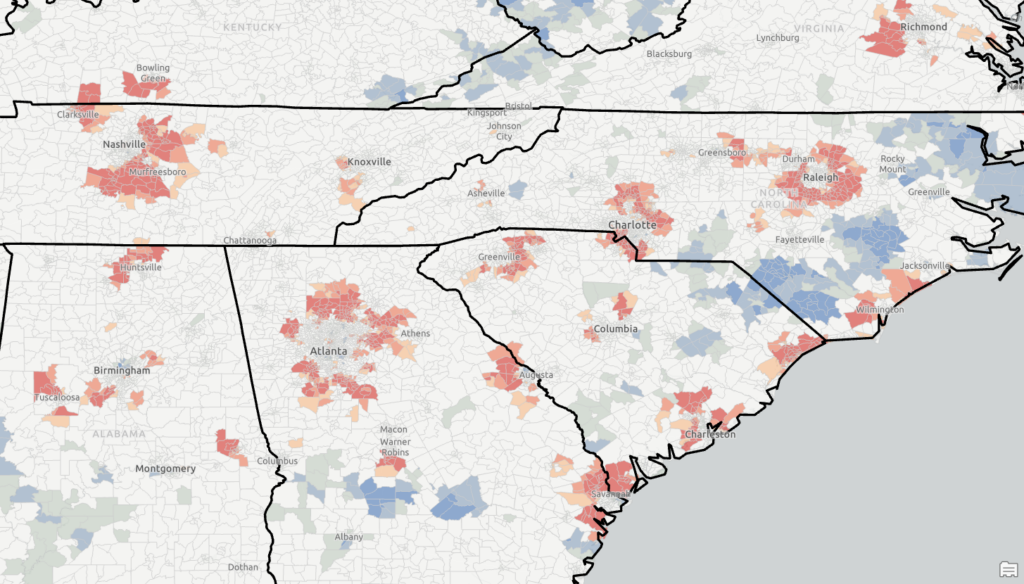
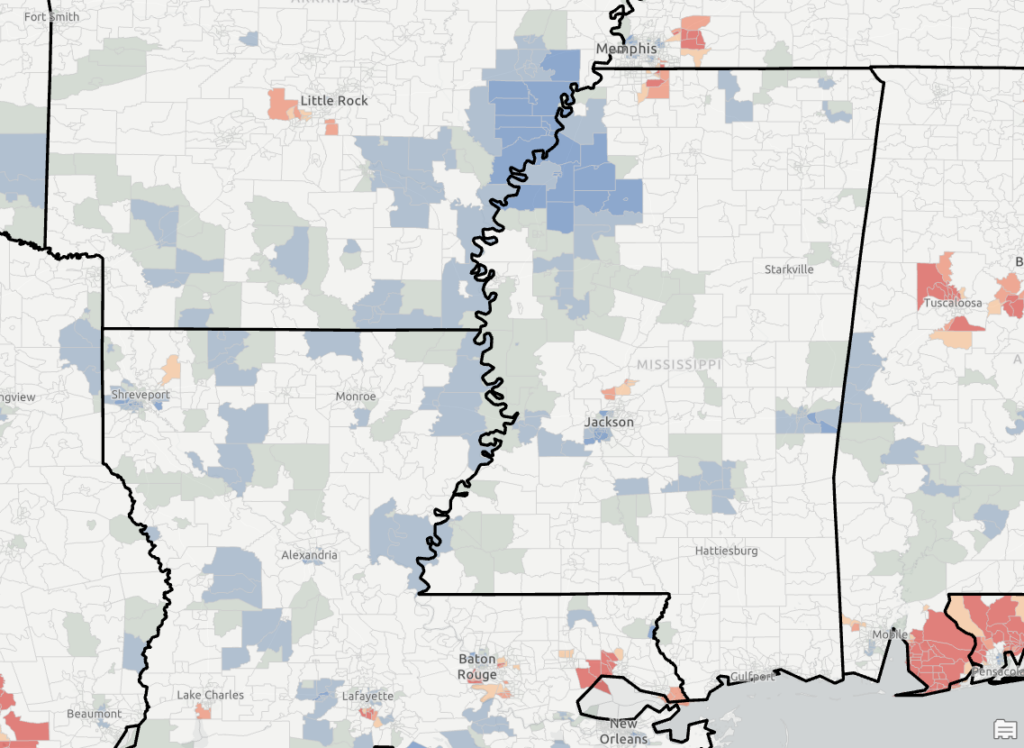
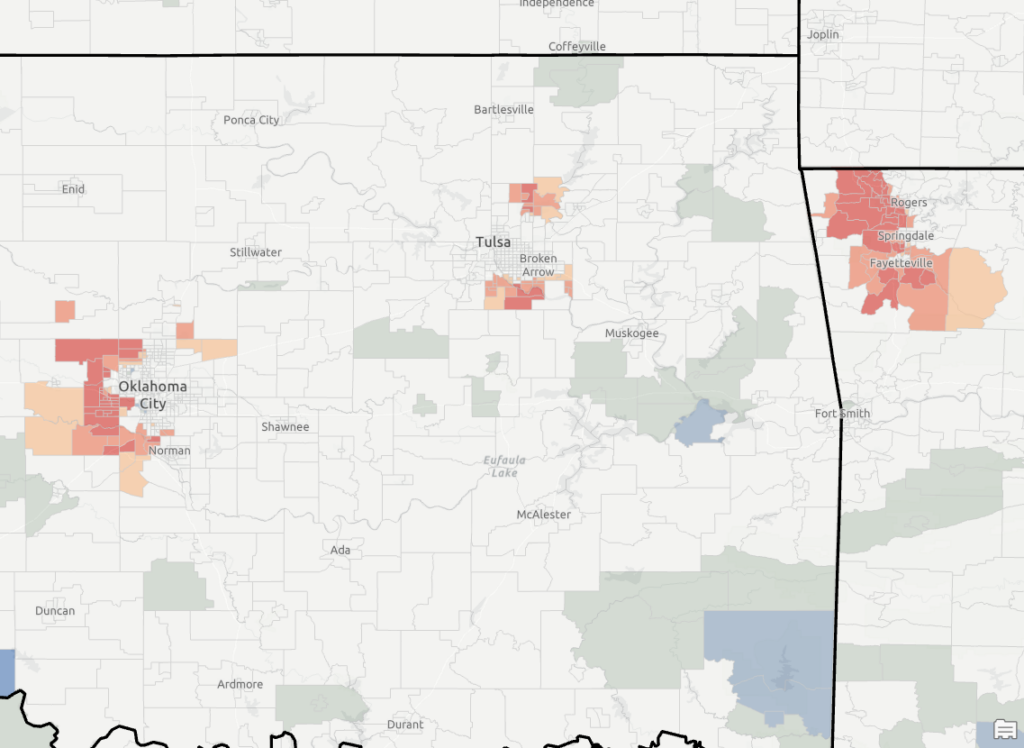
Using the Hot Spot Analysis tool, we analyzed population change by census tract from 2018 to 2023. Hot spots (red) signify areas with significant population growth, while cold spots (blue) represent areas of population decline. Below, we discuss trends observed across different regions of the U.S., supported by maps.
1. Texas
In Texas, the hot spot analysis reveals:
- Houston, Dallas-Fort Worth, Austin, and San Antonio metro areas experienced rapid population growth (hot spots).
- Suburban expansion in areas like Round Rock (Austin) and The Woodlands (Houston) is evident.
- Some rural areas, particularly in west Texas, showed signs of decline (cold spots).
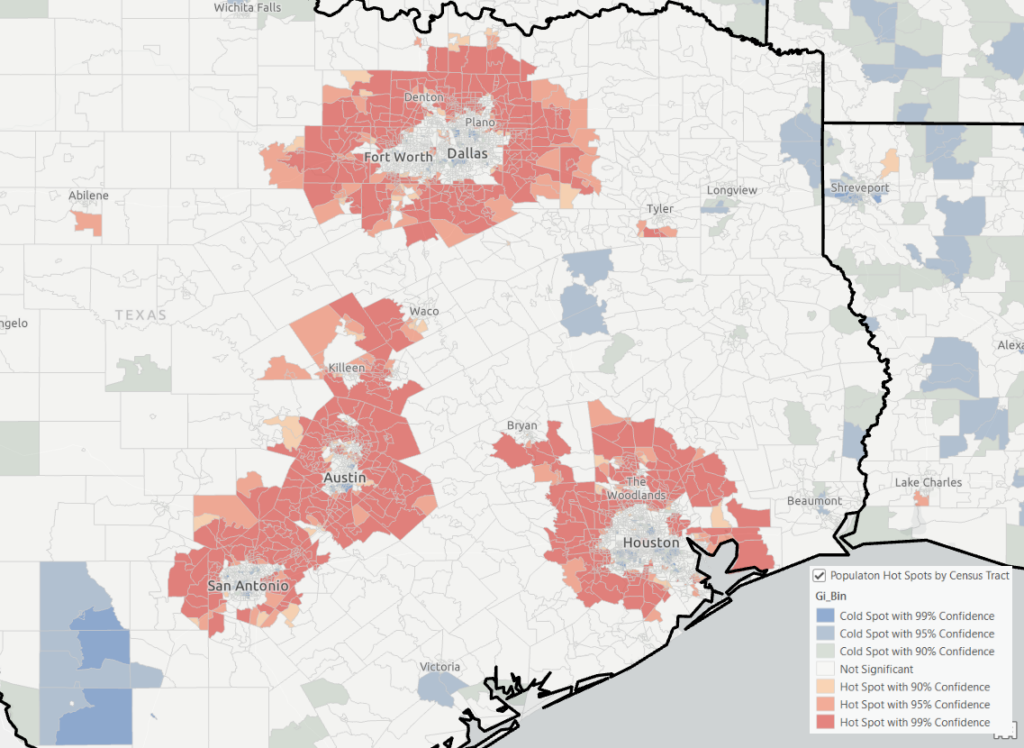
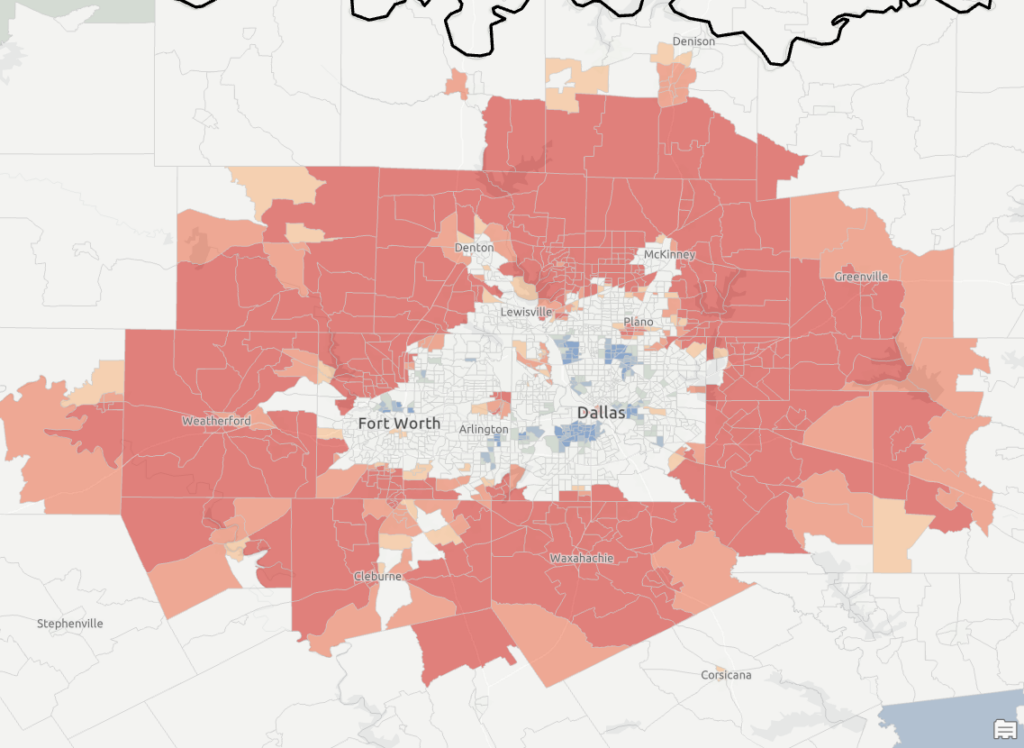
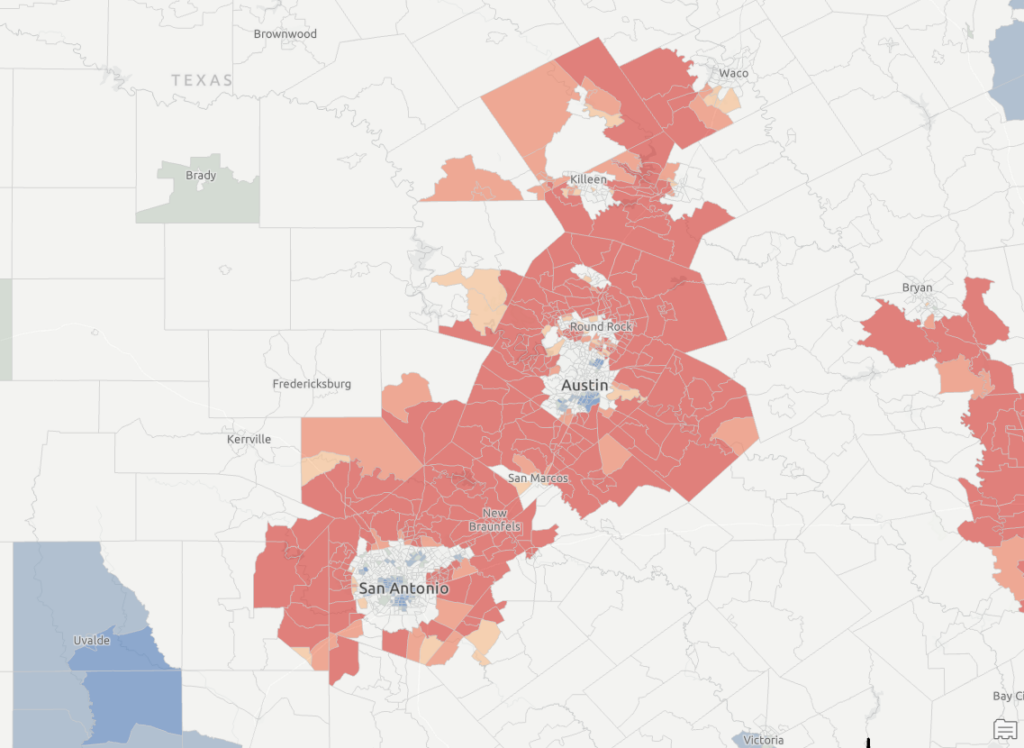
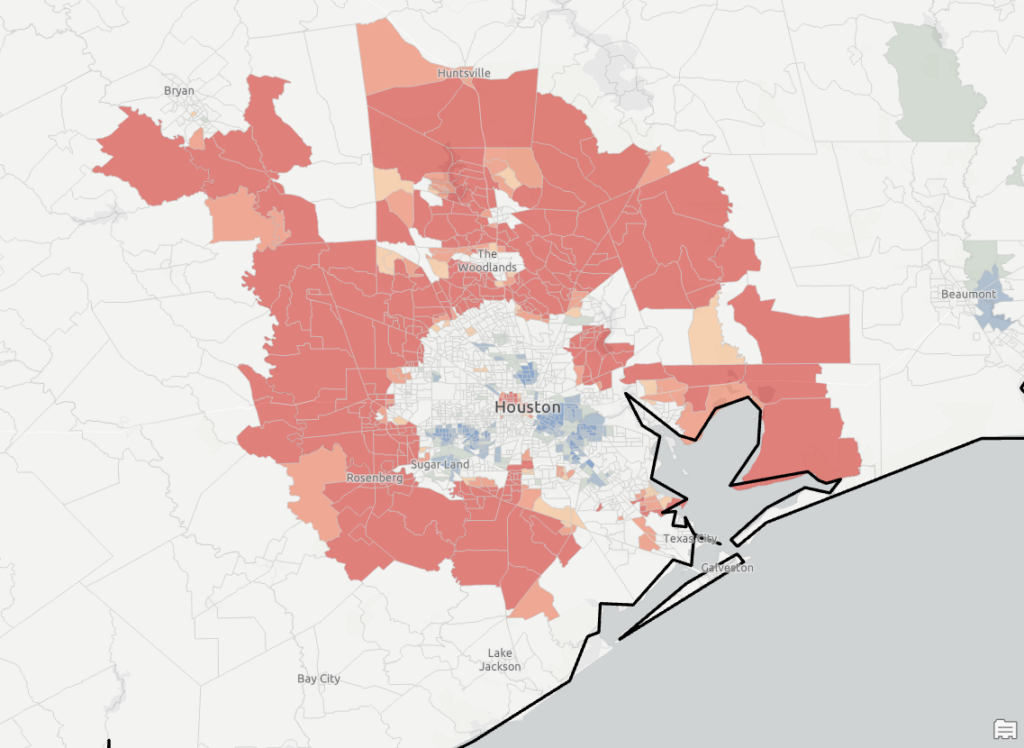
Texas’s urban centers continue to attract migrants due to strong economic opportunities, while rural areas face population challenges.
2. Florida
Florida’s analysis highlights:
- Orlando, Tampa, and Miami exhibit significant growth, driven by retirees, tourism, and business hubs.
- Northern Florida, including areas like Jacksonville, has emerging hot spots.
- The Panhandle revealed a mix bag of increasing population in the far western edges of the area while other areas around Tallahassee and south toward the cost revealed declining population trends.
The state’s coastal areas and urban centers dominate as hot spots for population influx.
3. California
California shows diverse trends:
- San Francisco Bay Area displays cold spots, particularly in San Francisco and Silicon Valley, as housing affordability remains a challenge.
- Hot spots appear inland, notably in areas like Tracy and Sacramento, where suburban growth is accelerating.
- Southern California regions like Riverside, Menifee, and Murrieta experienced significant population increases, while Los Angeles County saw mixed results with noticeable cold spots.
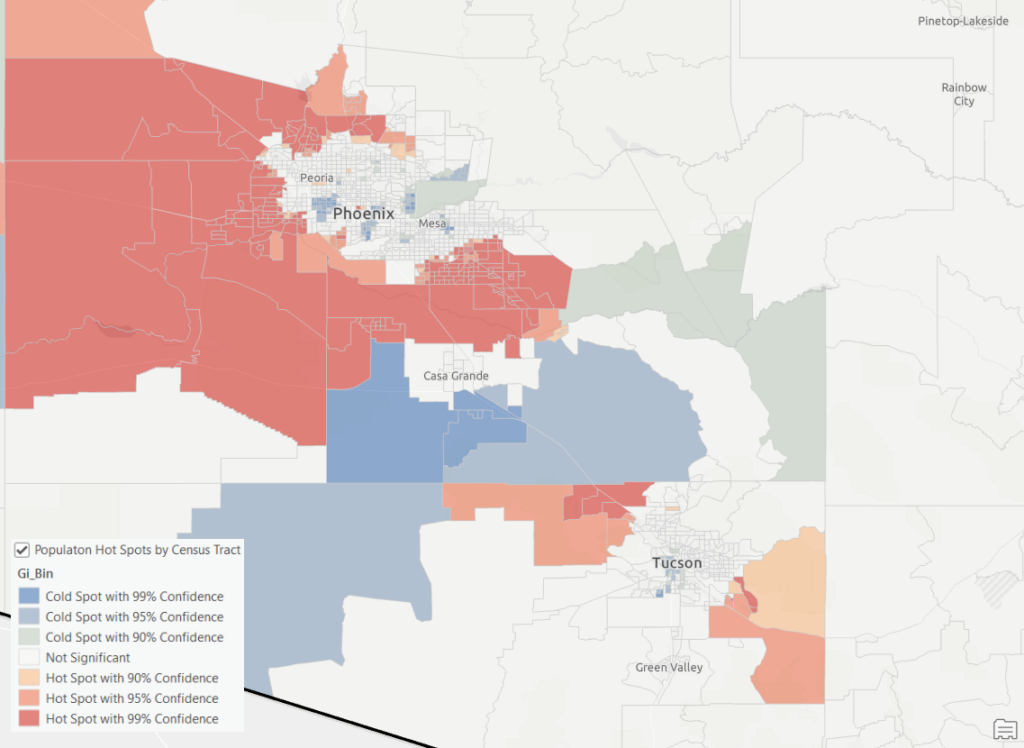
4. Arizona and Nevada
In the Southwest:
- Phoenix and surrounding suburbs show consistent hot spots of population growth.
- Las Vegas and Henderson in Nevada experienced strong growth, reflecting urban expansion and economic recovery post-pandemic.
- Northern Arizona, including Prescott, shows regional growth, while rural areas remain stagnant.
5. Utah and Idaho
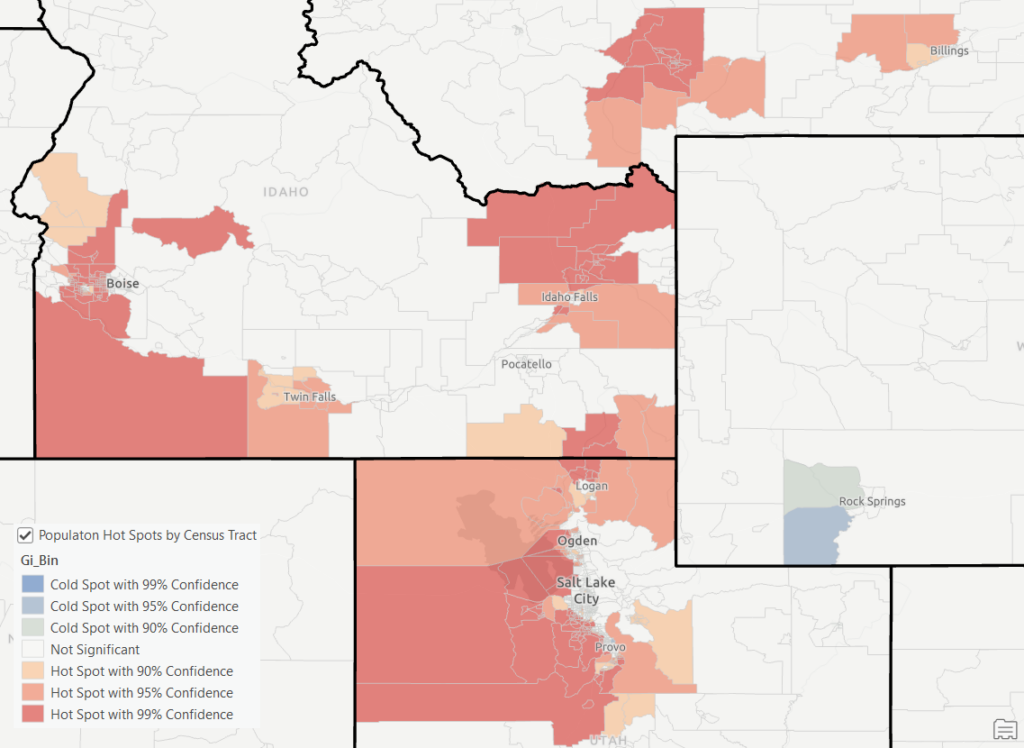
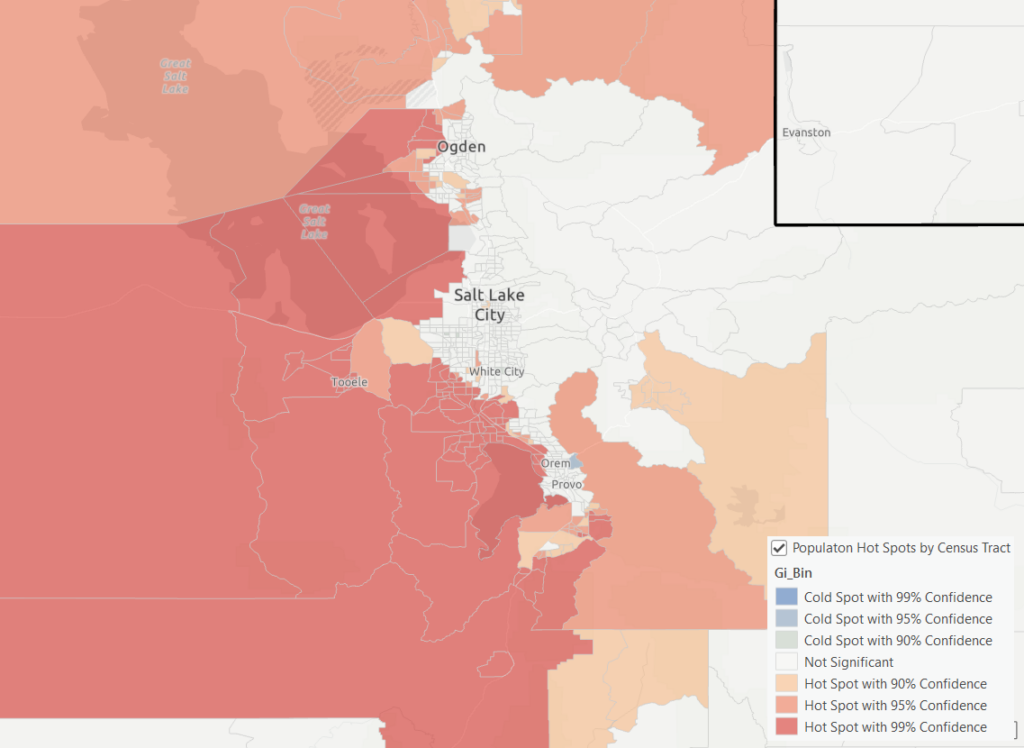
Population growth in Utah and Idaho is highly concentrated:
- Salt Lake City and surrounding regions, including Ogden and Provo, are dominant hot spots.
- Idaho’s Boise region experienced rapid growth due to migration from other states.
- Cold spots persist in remote rural areas where population decline continues.
These trends reflect growing economic opportunities and quality-of-life migration in the Mountain West.
6. Oregon and Washington
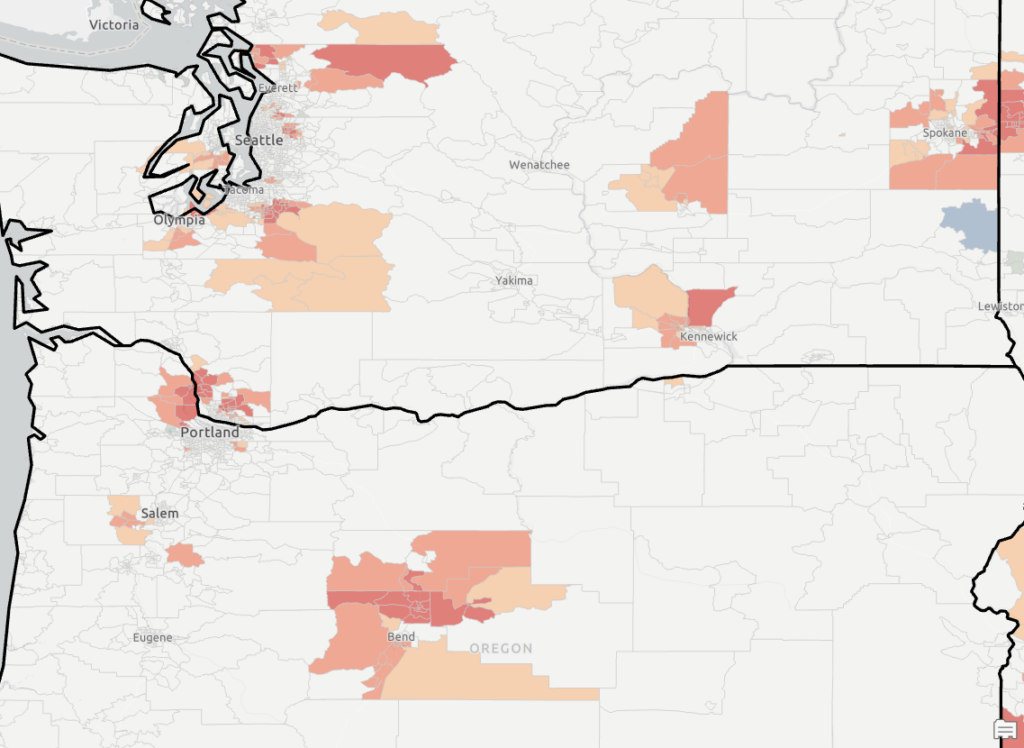
In the Pacific Northwest:
- Portland, Bend, and Seattle experienced strong growth hot spots, particularly in suburban areas.
- Central Washington, including regions near Kennewick, displayed population gains.
- Northern rural Oregon and parts of Seattle suburbs saw notable cold spots, indicating population shifts to more affordable regions.
7. The Eastern Seaboard
The Eastern Seaboard shows significant contrasts:
- Hot spots are observed in Richmond, Washington D.C., Philadelphia, and northern New Jersey.
- Cold spots appear in parts of West Virginia, rural Pennsylvania, and upstate New York, reflecting long-term economic challenges.
This region exhibits urban clustering, with growth concentrated in metropolitan areas.
8. The Midwest
Midwestern trends are mixed:
- Hot spots are seen around metro hubs like Indianapolis, Madison, Des Moines, and Sioux Falls.
- Cold spots dominate in rural areas, especially parts of Iowa, Nebraska, and Illinois.
- Declining industrial cities like Detroit continue to show areas of loss.
This reflects ongoing urbanization patterns and challenges in agricultural and industrial economies.
9. The Deep South
The Deep South highlights:
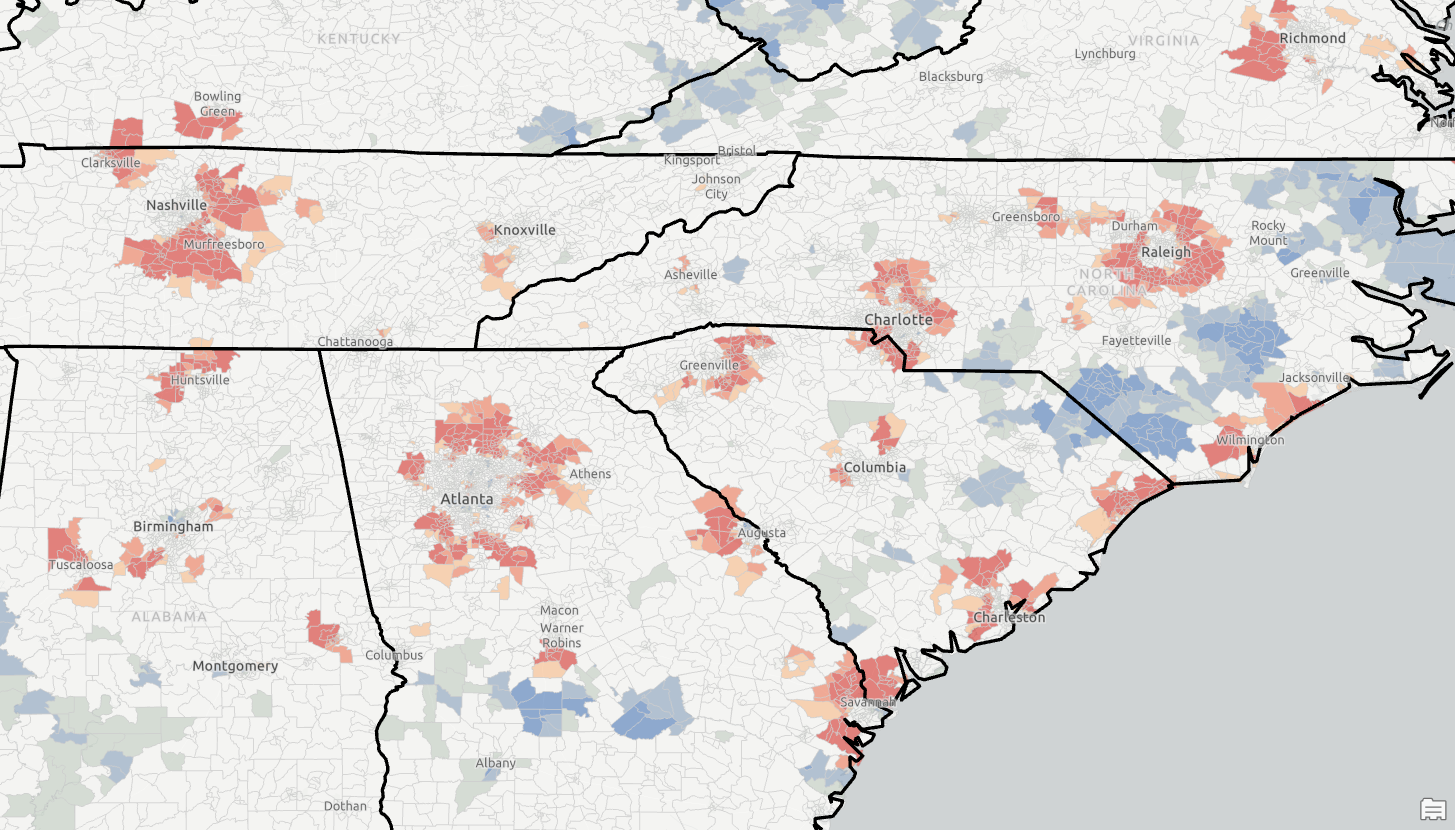
- Growth hot spots in urban hubs like Atlanta, Nashville, Birmingham, and coastal areas near Mobile, Alabama.
- Cold spots dominate in Mississippi Delta and rural areas of Louisiana and Alabama.
This underscores a divide between growing cities and struggling rural regions.
10. Oklahoma and Arkansas
In Oklahoma and Arkansas:
- Urban regions like Oklahoma City, Tulsa, and Fayetteville emerged as growth hot spots.
- Cold spots appear in surrounding rural counties, indicating slower population growth.
This reflects migration toward economic centers within the region.
Conclusion: Nationwide Trends
The Hot Spot Analysis of population change from 2018 to 2023 reveals clear patterns:
- Urban Centers: Cities like Phoenix, Austin, Orlando, and Boise continue to attract significant population growth.
- Suburban Expansion: Outlying suburbs, particularly in Texas, Florida, and California, show robust growth trends.
- Rural Decline: Cold spots persist in rural areas, especially in the Midwest, Deep South, and Appalachia.
- Regional Variability: Coastal states and the Southwest outpace other regions, while the Northeast and parts of the Midwest face slower growth.
Applications of Hot Spot Analysis
The Hot Spot Analysis tool provides actionable insights for:
- Urban Planning: Understanding where infrastructure investments are needed.
- Economic Development: Targeting regions with growth potential.
- Policy Decision-Making: Addressing population decline in vulnerable areas.
- Migration Analysis: Identifying trends driving population shifts.
ArcGIS Pro’s tools allow researchers, planners, and policymakers to visualize and analyze these patterns effectively, enabling data-driven decisions for the future.
By examining population change spatially, we gain a deeper understanding of the forces shaping communities across the United States. Whether addressing growth challenges in booming metros or supporting struggling rural areas, tools like Hot Spot Analysis are essential for informed decision-making.

