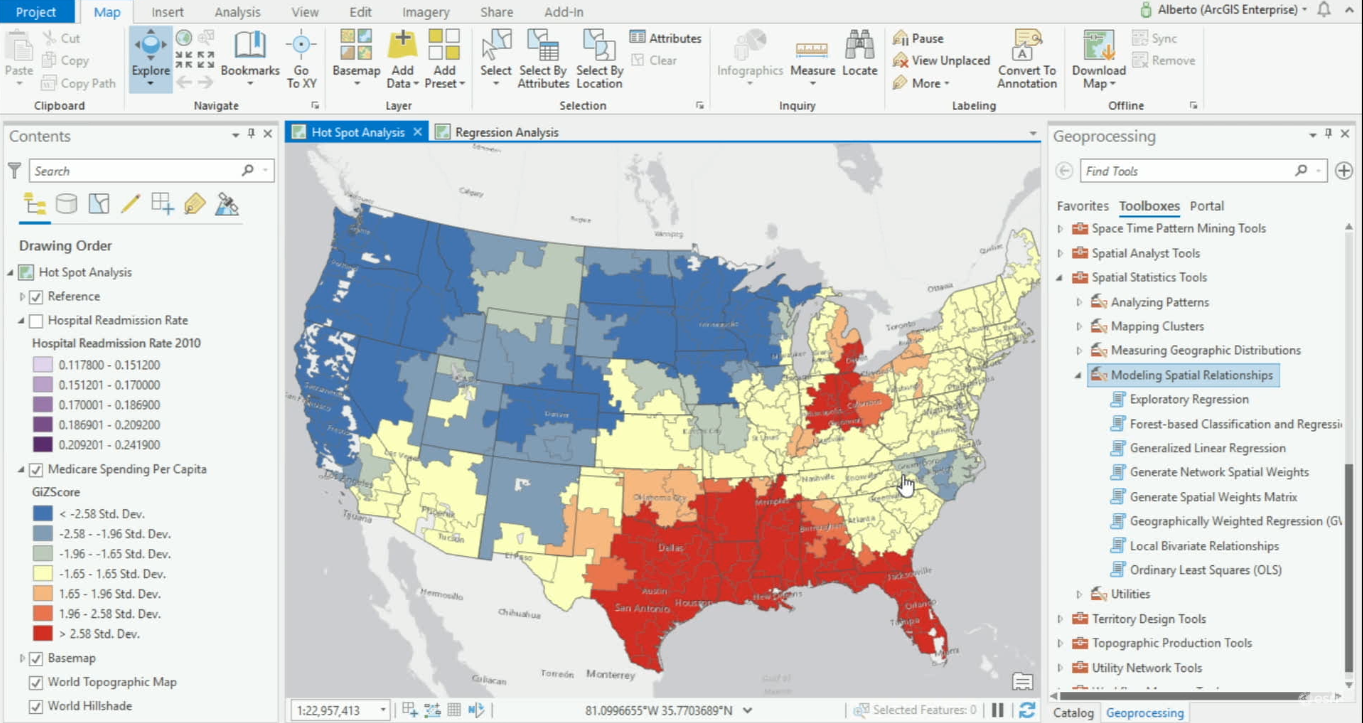
ArcGIS Pro offers various geoprocessing tools for modeling spatial relationships. ArcGIS Pro 2.4 offers one new tool for modeling spatial relationships and expands its Ordinary Least Square’s tool, now renamed Generalized Linear Regression tool.
When variables are related, you can learn about one variable by observing the values of related variables. Modeling relationships is useful for exploring correlations, predicting unknown variables or understanding key factors. Estimating linear relationships between variables happens through a statistical process called linear regression. Such a relationship can be positive, negative or non-existent. Linear regression calculates the strength of the relationship between one or more exploratory variables (x) and dependent variable (y). Because models are far from perfect, there will be over- and underpredictions; these are differences between observed and predicted values.
An short overview of the Modeling Spatial Relationships toolset
ArcGIS Pro offers a set of tools for modeling spatial relationships. These are found under the spatial statistics toolset. These tools not only create new layers using an input dataset, but also produce tool messages with lots of numerical data, in the form of different statistics that show if there’s a strong or weak correlation. An example is the adjusted R square value: if this value nears one, it means there’s a strong correlation between values. Statistically significant values are displayed with an asterisk in the output. The output of the results also enables the creation of reports with a nice-looking layout.
Generating a fitting model to your dataset is not a linear process, but involves a lot of try-and-error, where the output of one tool is often used as input for another modeling spatial relationships tool. ArcGIS Pro offers excellent documentation that explain how these tools work, as well as how to interpret the results.
Generalized linear regression (GLR) tool
This tool performs Generalized Linear Regression (GLR) to generate predictions or to model a dependent variable in terms of its relationship to a set of explanatory variables. Before running the tool, you need to define an input dataset as well as a dependent variable, model type and exploratory variable(s). Model type is explained below.
With the release of ArcGIS Pro 2.4, the Ordinary Least Squares (OLS) tool has been renamed as Generalized linear regression tool. It now combines three different model types: in addition to the existing OLS model type (named Gaussian and appropriate for continues data), it offers a logistic model type for binary data and a Poisson model type for count data. These two additional model types might be appropriate if a data distribution is not bell-curved. Continuous variables then have be converted to a binary variable, such as zeros and ones (indicating if they are above or below the mean value). Binary data is used to predict the presence or absence of something, such as insurance fraud, fire damage or pass/fail inspection. A Poisson model is for modeling a count variable, such as crime counts, traffic accidents or sales per month. These values need to be positive integers and can’t have decimals.
Exploratory regression tool
The Exploratory Regression tool evaluates all possible combinations of input candidate explanatory variables, with the goal of looking for Ordinary Least Squares (OLS )models that best explain the dependent variable, within the context of user-specified criteria. This tool is a good starting point for exploring a dataset, as it tests all variable combinations for redundancy, completeness, significance, bias and performance. The main output of the tool is a messages window, showing passing models. This tool also uses another tool from the spatial statistics toolbox called the Spatial Autocorrelation tool (Global Moran’s 1), that measures spatial autocorrelation based on feature locations and attribute values. This tool can also be accessed independent from the Exploratory regression tool.
Geographically weighted regression tool (GWR)
This tool is used for exploring spatial variation and is comparable to the earlier mentioned Generalized Linear Regression (GLR). However, where the GLR tool creates a global model for all features in one study area, GWR looks at local differences between features, using data from neighboring features only. It is based on the idea things near each other tend to have stronger relationships than between things that are far away from each other, and therefore focuses on neighboring features.
Local bivariate relationships tool This is a new geoprocessing tool added with ArcGIS Pro 2.4 and quantifies the relationship between two variables on the same map. This is done by determining if the values of one variable are dependent on or are influenced by the values of another variable, and if those relationships vary over geographic space. The tool first analyzes two variables for statistically significant relationships. If there’s a relationship between the two, the type of relationship is determined, using the following six relationship categories: not significant, positive linear, negative linear, concave, convex or undefined complex. The tool should be used with continuous variables and accepts points and polygon layers as input.

