

ArcGIS Experience Builder provides a powerful set of Data Actions that allow users to interact with data across multiple widgets. Data Actions are actions that your end users can decide to utilize at run time, such as exporting selected data. While there are many available actions, some stand out for their ability to enhance user experience, streamline workflows, and improve data exploration.
This article highlights the top five data actions and explains how they can add value to your applications.
1. Export – Save and Share Your Data
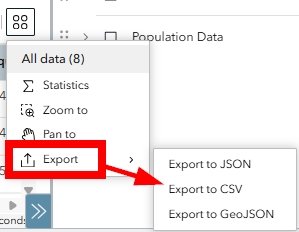
The export action allows users to extract selected data and save it as a file for further analysis. This is particularly useful for applications that require data sharing or offline processing.
Why it’s useful:
- Enables users to download attribute data from tables or map layers
- Supports formats like CSV, allowing seamless integration with Excel or GIS software
- Works well in dashboards, allowing analysts to quickly export reports or filtered data subsets
Use case example: A city planning dashboard allows users to select parcels of interest and export the data for further analysis in ArcGIS Pro or Excel.
2. Statistics – Gain Instant Insights

The statistics action provides real-time summaries of numerical fields within selected data. It calculates key statistics such as sum, average, minimum, and maximum values, giving users quick insights without needing external analysis tools.
Why it’s useful:
- Eliminates the need to manually calculate totals or averages
- Helps users understand trends, distributions, or data variations at a glance
- Works well with filtered datasets to dynamically update statistics as selections change
Use case example: A crime-mapping application lets users select incidents within a specific area and immediately see the total number of cases, average response times, and crime type distribution.
3. Show on Map – Highlight Key Locations
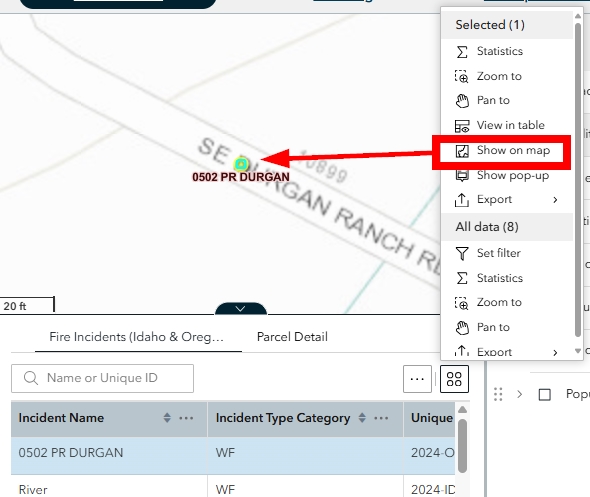
The show on map action allows selected features from a widget, such as a list or table, to be visually highlighted on a connected map widget. This is essential for applications where users need to spatially locate records from a dataset.
Why it’s useful:
- Helps users quickly visualize selected data points on a map
- Works well with other actions like zoom to and show pop-up for a richer mapping experience
- Useful in apps where users search, filter, or browse lists of locations and need to see them mapped
Use case example: An emergency response app allows dispatchers to filter incident reports by priority level and then use show on map to immediately visualize the high-priority locations needing urgent attention.
4. View in Table – Explore Tabular Data Interactively
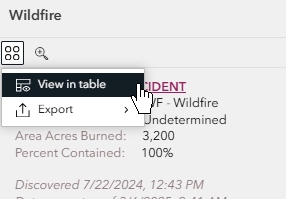
The view in table action dynamically connects spatial features and tabular data, allowing users to see related records in a table widget when a selection is made. This is particularly useful for multi-layer or relational data applications.
Why it’s useful:
- Provides a structured way to view and explore attribute data tied to spatial features
- Helps users compare multiple records at once
- Supports applications with linked datasets, such as parcel ownership records, facility inspections, or business inventories
Use case example: A utility management app allows users to click on a water main in a map widget, triggering the view in table action to show all related maintenance records for that pipeline.
5. Filter – Focus on What Matters
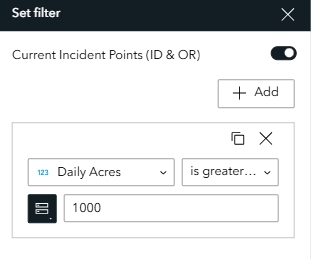
The filter action allows users to dynamically refine displayed data by hiding or showing records based on specific conditions. This is one of the most powerful data actions, as it lets users narrow down large datasets to find relevant information quickly.
Why it’s useful:
- Helps users focus on specific subsets of data based on attributes such as date, category, or status
- Can be combined with other actions like statistics and show on map to enhance interactivity
- Reduces clutter in applications with large or complex datasets, improving usability
Use case example: A real estate app allows users to filter for-sale properties based on price range, number of bedrooms, and neighborhood, ensuring that only relevant listings appear on the map and table.
Final Thoughts
These five data actions—export, statistics, show on map, view in table, and filter— empower users to analyze, visualize, and interact with data dynamically, making applications more intuitive and insightful. Whether you need to summarize data, visualize selections on a map, or allow users to download key datasets, these actions provide practical and efficient solutions.
