Many ArcGIS Server applications need to be able to query data from a map service and display the results in a tabular structure. In this post I’ll show you how to use the DojoX DataGrid along with ItemFileReadStore and QueryTask from the ArcGIS Server JavaScript API to display your query results in a tabular structure. The process is really quite simple once you understand the basic concepts.
The new DojoX DataGrid is an excellent user interface control for displaying tabular data and is tightly integrated with the Dojo Data stores including ItemFileReadStore. In a previous post I showed how you can use Dojo’s ItemFileReadStore class to read JSON format data. We’ll build on that example in this post by populating an instance of ItemFileReadStore with the contents of a query that we perform against a map service layer. ItemFileReadStore is then integrated with the DojoX DataGrid to display the results of our query.
Here is a simple example that we’ll use to illustrate this process. Simply enter a U.S. state abbreviation to see the example in action.
The Map Service
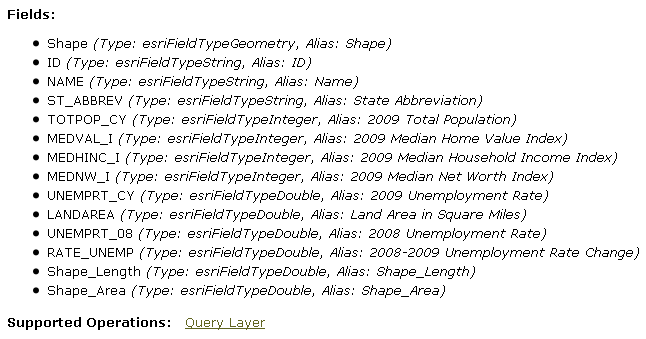
We can start by examining the map service that we’ll use to perform our query against. ESRI has published a number of demographic services to ArcGIS Online including one that can be used to obtain unemployment information for the U.S. from 2008 and 2009. This data is provided at the state, county, census tract, and census block group levels. Take a few moments to examine the map service. For our purposes in this simple example we’ll be querying the counties layer (3). As you can see in the figure below this layer contains a number of data columns and supports the Query Layer operation. Essentially this just means that we can perform an attribute (or spatial) query against the fields that you see listed.

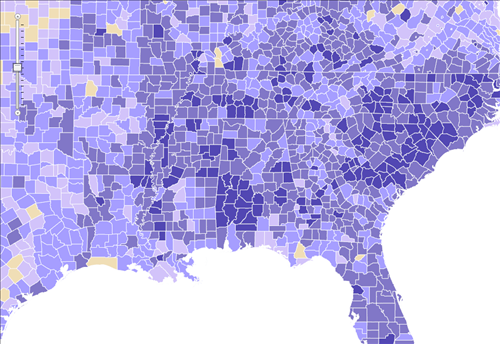
This service can also be used to display a thematic map of the unemployment information by any of the geographic levels that we listed above.

Creating the DojoX DataGrid
The next thing that we’ll need to do is create the actual DojoX DataGrid that will hold the results of our query. There are a few simple steps that we need to perform to do this.
Style Sheets
First we need to load the Dojo style sheets that are used to control the display characteristics of our DataGrid. We can do this by adding the following lines of code in the <head> section of our web page.
![]()
Resources
Next we add in the resources that will be used. Notice here that we are also include a reference to esri.tasks.query which includes the Query and QueryTask objects that will be used to define the parameters for our query and execute the query against the map service layer.

The DataGrid
Finally, in the <body> section of our web page we define an HTML table with a dojoType of ‘dojox.grid.DataGrid’. Notice that the field attributes defined in our table exactly match the field names found in the layer contained in our map service.

Query Parameters and Execution
Next we need to create an instance of QueryTask which points to the counties layer in the ESRI unemployment map service. We also create an instance of Query and set the returnGeometry and outFields properties. The returnGeometry property specifies whether or not you need to return the geometric definition of each of the features that match the query. In this case we are simply presenting the results in a DataGrid so there is no need to return the geometry. However, if you were also going to use the features in some way such as creating graphics in addition to presenting the data in a table you’d want to set this value to ‘true’. The outFields property specifies the data columns that will be returned. This property is frequently used to limit the information returned.

We have also defined a ‘doQuery’ function that accepts a state abbreviation.

In the interest of focusing on our topic we haven’t defined any error handling routines to handle values other than a matching two character string for each state so do realize that you will get an unhandled exception if you do no enter a matching state abbreviation. Obviously this is something that we would handle in a real application. In ‘doQuery’ we set the ‘where’ property on Query. This property functions like a SQL statement. In this case we are querying for the state abbreviation entered by the user. Finally, we call the QueryTask.execute method to perform the query. Notice that we are passing in the query parameters and also defining a callback function called ‘showResults’ that will execute upon completion of the query.
Display the Query Results
Now comes the interesting part where we tie all this together. Our ‘showResults’ function is callback function which means that it is called after the query has finished. A FeatureSet object is passed into this callback function. This object contains an array of features each of which may contain geometry, attributes, symbology, and an InfoTemplate. In this case our features do not contain geometry since we set the ‘returnGeometry’ property to false. Therefore, we can treat our FeatureSet as a table wherein each feature functions as a row object. Please refer to the figure below as we discuss what happens inside ‘showResults’. First we create an array variable called ‘items’ and we populate this variable with the attributes of each row returned by our query. Next we need to create the JSON structure that will be used as input in the creation of an instance of ItemFileReadStore. As I pointed out in “Reading JSON Data with Dojo” ItemFileReadStore requires a specific structure for JSON data. This includes the use of an identifier property, an optional label property, and the data itself arranged in an array of attribute/ value pairs specified with an items property. The attribute/value pairs have already been created an stored in the ‘items’ variable. In this case we specify that the ‘ID’ field will be used as both our identifier and label. The identifier needs to be a unique value which is what we get with the ‘ID’ field. Finally, we create a new instance of ItemFileReadStore using the JSON data structure we defined in the ‘data’ variable and use this store as input for our DataGrid. Here, the DojoX DataGrid was defined with an id of ‘grid’ when we created the DataGrid in a previous step.

So, as you can see, the steps for displaying the results of a query against an ArcGIS Server map service are really quite simple.
