
In this tutorial, we will create a mosaic dataset in ArcGIS Pro and populate it with raster images that can be used for further analysis.
A mosaic dataset in Pro can be regarded as a subclass of a file geodatabase. They are used to manage raster data: creating a new mosaic dataset is done from an existing file geodatabase and from there you can add raster data to it. A mosaic dataset looks just like a normal geodatabase but has extra functionality for displaying and managing raster files. In this tutorial, we will show how to create a new mosaic dataset in Pro, populate it with raster files from disk and use raster functionality for further analysis.
STEP 1: Downloading the data
To populate our mosaic dataset in Pro later, we will need some raster data. Here, we will use raster data from OpenAerialMap, a website that collects worldwide aerial imagery that can be downloaded for free without any prior user registration. The website offers a mapping interface that lets you select drone mosaics from a specific area of your choice.
To start searching for imagery, click the “start exploring” button on the homepage, select the latest added imagery to the project or select an area of interest on the map: when you click on a map tile, the available images from that region will be displayed on the left. Next, click the download button on the grey menu next to the filename to start downloading a .tiff file, as displayed on the image below:
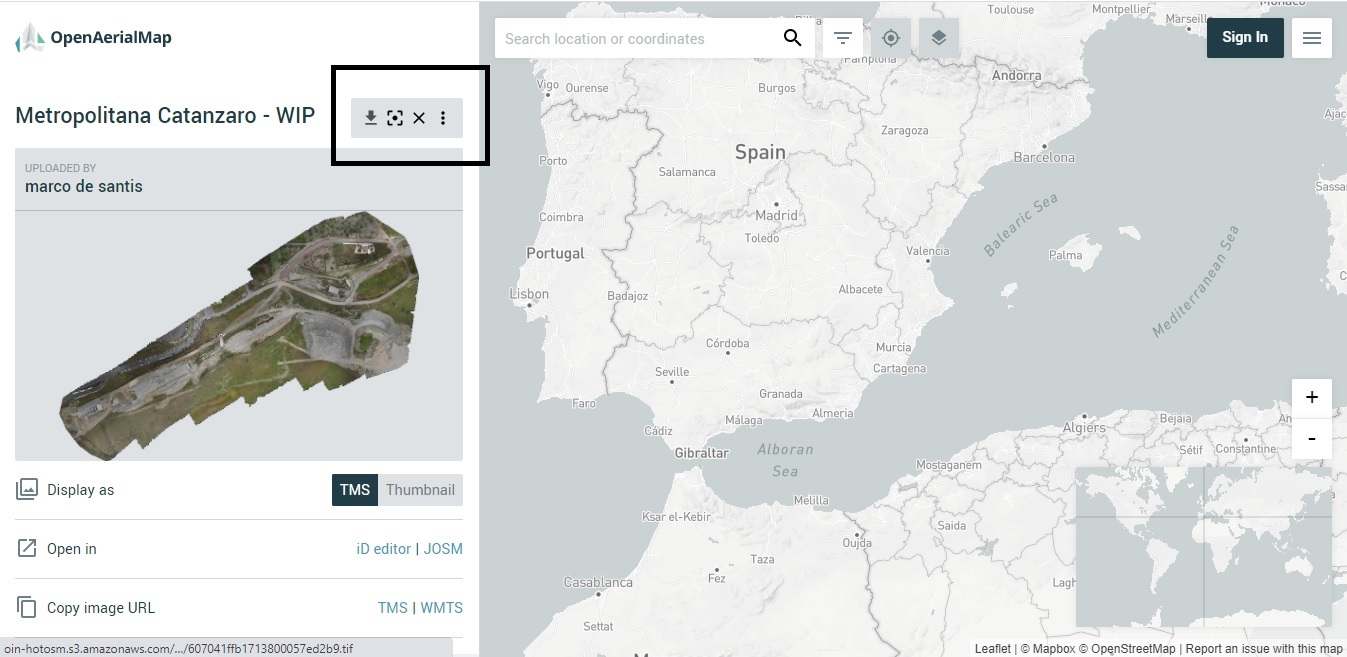
Repeat the process for one or two more .tiff files and store them in the same folder, for example in c:\users\username\downloads\tiffs.
STEP 2: creating a new project and mosaic dataset in ArcGIS Pro
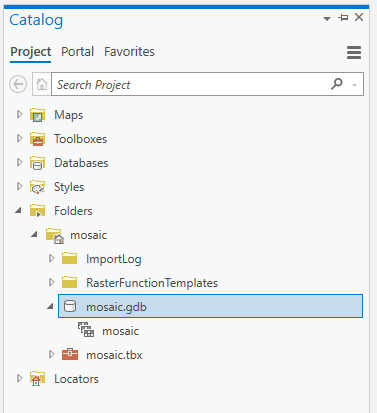
Launch ArcGIS Pro and create a new project. This project uses the name “mosaic”. Next, head over to the Catalog window and look for the file geodatabase file for the project, which is called “mosaic.gdb” in this case. Right-click the file and select “New” -> “Mosaic Dataset” to create a new mosaic dataset. This will launch the “Create Mosaic Dataset” geoprocessing tool. Fill in a name for the dataset and hit “run”. After the tool finishes running, you will see in the Table of Contents that there is a new feature layer called “mosaic” that includes a Boundary, Footprint, and Image layer. In the Catalog window, you will also see a new icon inside the file geodatabase that represents the mosaic dataset:
STEP 3: adding raster data to the mosaic dataset
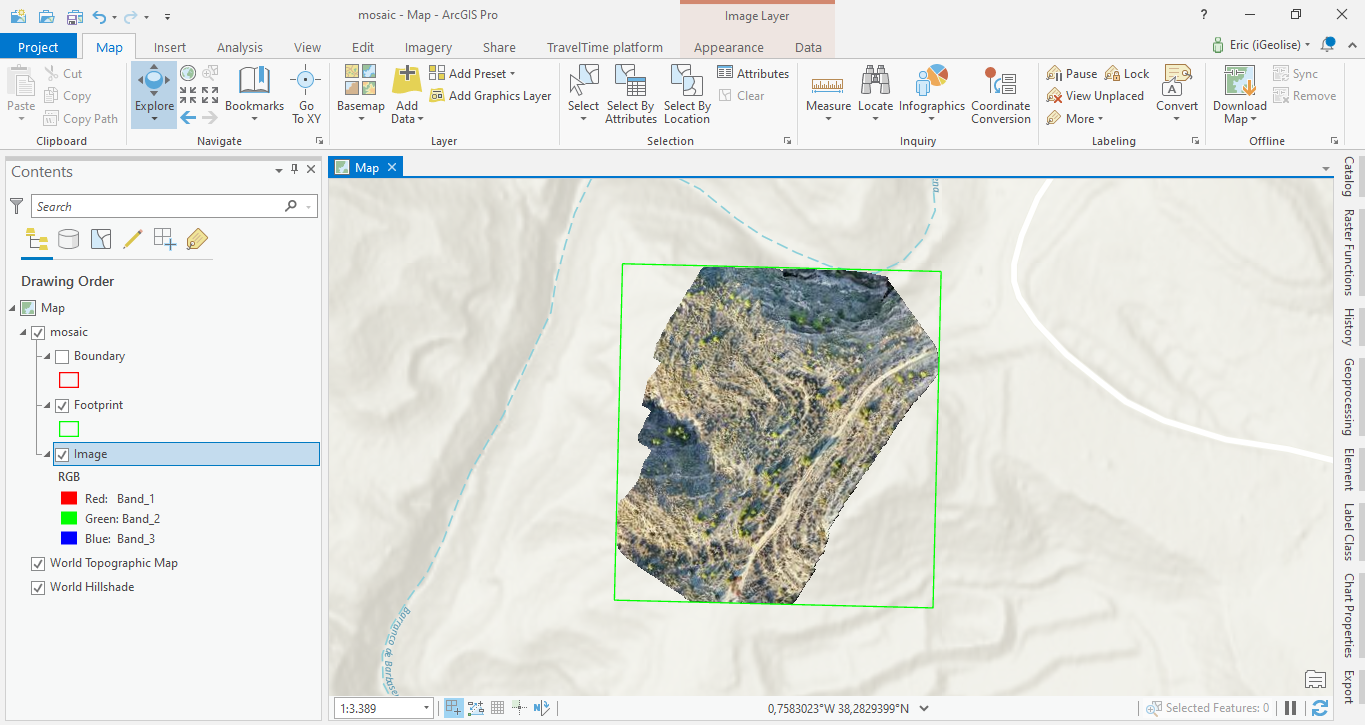
We can populate the empty mosaic dataset with the raster images we downloaded earlier from OpenAerialMap using the “Add Rasters to Mosaic Dataset” geoprocessing tool. Locate the tool in the Geoprocessing menu, open it and select of the mosaic dataset that was created under step 2. Next, select “folder” under “Input Data”. To add the raster imagery folder with the downloads, you might need to make a folder to connection in the Catalog pane first in order to be able to add it here for this geoprocessing tool. Next, click the “+” button to browse to the imagery folder and add it to the Input Data menu. After adding it, click “Run” to add the imagery to the mosaic dataset. After the tool finished running, you will notice that three image bands are added to image layer in the Table of Contents.
To look at the imagery on the map, click the image layer in the Table of Contents and select “Zoom to Layer”. Because only the Footprint layer is visible except for the image, you will need to zoom into a small green point to be able to see the imagery. Here is a screenshot showing one of the three images that were added to the Mosaic Dataset:
STEP 4: using raster functions for further analysis
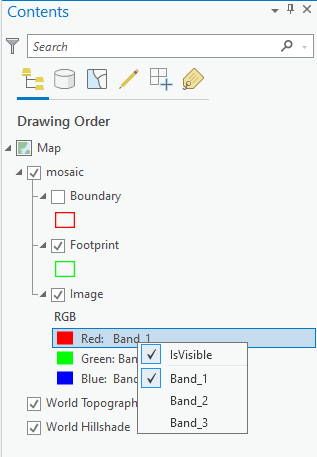
With the imagery added to the mosaic dataset, we can now start working with it using Pro’s analysis functions. For example, we can swap or combine different image bands by right clicking the individual bands of Image layer inside the Table of Contents:
More raster functions are available by clicking “imagery” on the ribbon interface and selecting “raster functions”. For example, the Stretch tool (under the Appearance menu) enhances an image by adjusting the range of values displayed, without changing the underlying pixel values. By choosing the Stretch Type “PercentMinMax” under Stretch Properties for our mosaic dataset, the display of individual pixels will improve when zooming in.
