
The latest version of ArcGIS Pro includes a new tool to cluster points into polygons. The resulting polygons can be aggregated into larger polygons using the Aggregate Polygons tool.
Introduction
This tutorial explains how point data can be aggregated into polygon features. Based on spatial proximity, points can be grouped into a single polygon. The latest version of ArcGIS Pro (3.1) offers the Aggregate Points tool, that does exactly this. It is found in the Generalization Toolbox within the Cartography Toolbox. Next, we’ll use the resulting polygons as input for the Aggregate Polygons tool, which is found within the same toolbox as the first tool.
Although the resulting data has no significant meaning by itself, these two tools show how you can aggregate point features into different spatial features (polygons), that can be used for further analysis. In this case, we’ll group points that resemble parks and protected lands. By aggregating these across the United States, we get a spatial distribution of such areas that can be used for spatial planning or wildlife preservation.
STEP 1: Download the data
We’ll use the Natural Earth Quickstart kit data, which is a large ZIP file that contains a shapefile with the point data we need for this tutorial. Download the file, unzip to a local hard drive, and open Pro. Create a new project and open the Catalog pane. Click the “computer” tab and navigate to the unzipped data you have just downloaded. Right-click the folder and select “Add to Project”. Now select the “Project” tab in the Catalog pane and notice that the file folder is listed under Folders. Open the 10m_cultural folder, drag and drop the “ne_10m_parks_and_protected_lands_point.shp” file to the map. For this tutorial, we need the point file data so we can aggregate them to polygons.
If you right-click the layer in the Contents pane on the left of the screen and select “Zoom to layer”, you will see that most of the points are found inside the US. We’ll now aggregate those into polygons.
STEP 2: Aggregate the points
We’ll now select the Aggregate Points tool to create polygons from our points. Click the Analysis tab in the ribbon interface and next Tools. Under toolboxes, select “Cartography tools” and next “Generalization” and “Aggregate points”. The tool has three input parameters: an input dataset (our points layer), an output layer name and an Aggregation Distance. To produce the results below, use 250km as the aggregation distance. Click run and notice how Pro adds a new polygon layer to the map. I added a strong yellow color so you can see them better.
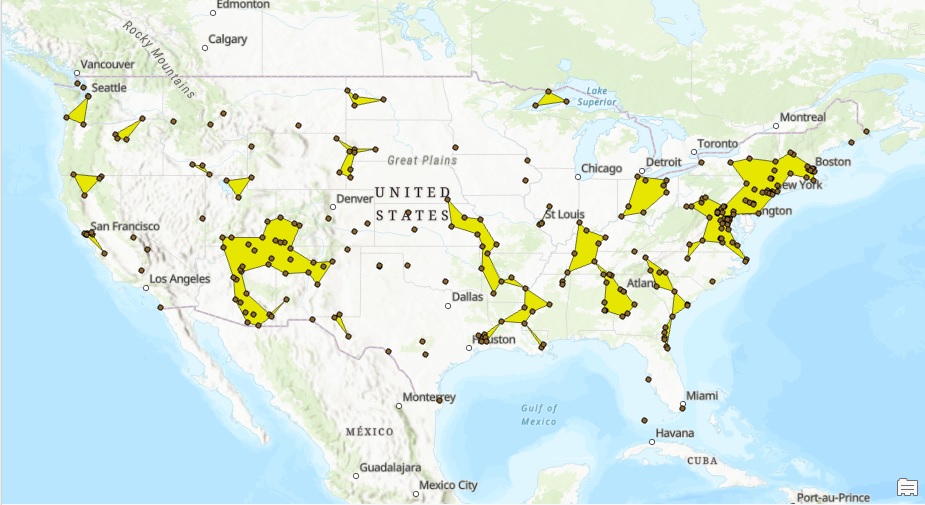
You can see that not all points have been aggregated to a polygon, as a result of the aggregation distance value. We’ll now aggregate these polygons so that separated but geographically approximate polygons are united.
STEP 3: Aggregate the polygons
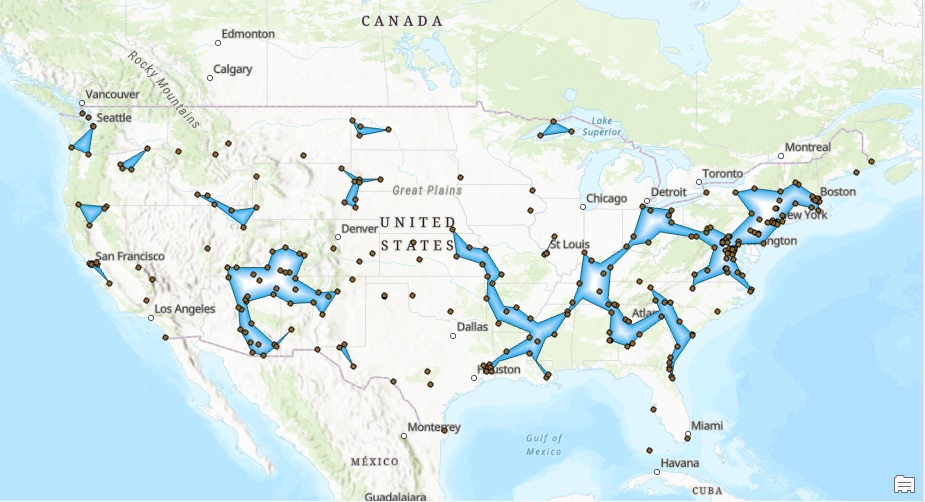
The Aggregate Polygons tool is found in the same toolbox as the Aggregate Points tool, so inside the Generalization Toolset that is found within the Cartography Toolset. This toolset has more optional parameters, but all we need are the same three parameters as before: an input feature class (the polygon layer created under Step 2), an output feature class name and an aggregated distance. To produce the results below, use again 250km. I used a buffered gradient (in blue and white) from the Symbology tab to visualize the aggregated polygons. This is a map view of the newly aggregated polygon layer, with the point layer on top:
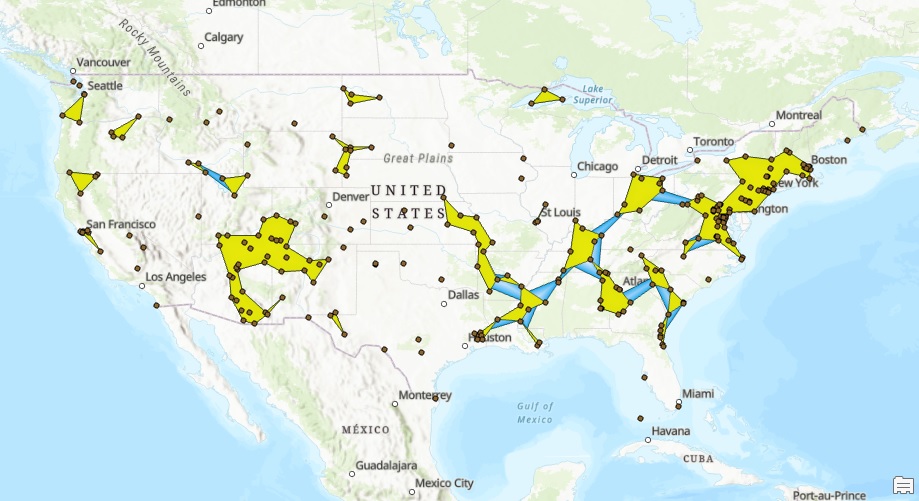
Here you can see the same layer but with the yellow, individual polygons positioned on top to show how the blue, aggregated polygons “connect” the separated yellow polygons used as input to the Aggregate Polygons tool:
STEP 4: Inspect the data
Finally, let’s have a look at the standalone tables and the attribute tables created for each new feature class. If you open up the attribute tables for each of the two newly created polygon feature classes, you will see that each feature (table row) represents a newly created polygon. If you select a row in one of both attribute tables, the accompanying feature will be highlighted in the map window. The individual tables show which input features are contained within each polygon. Starting with 315 point features, we aggregated these to 29 polygons using the Aggregate Points tool and applying the Aggregate Polygons tool reduced that number to 15 polygons.
