ArcGIS Business Analyst for ArcGIS Pro gives users access to location data and advanced spatial analytics techniques, that help businesses do market analysis and communicate the results inside their organization through infographics and reports.
ArcGIS Business Analyst is an application that provides location-based intelligence for planning, site selection and customer segmentation. The application is available through the web, desktop and mobile. This blog post focuses on the desktop version, available as an extension for ArcGIS Pro. All three versions combine different datasets with location analytics, that can be shared in one’s organization through presentations and reports, available as easily customizable templates.
Apart from being available as a separate web application for mobile and tablets, ArcGIS Business Analyst on desktop comes installed with ArcGIS Pro as a product extension that adds data and functionality to the application. It can be used with a named user account, for example a single license, concurrent use license or ArcGIS Online account. The extension adds functionality to ArcGIS Pro core functionality as well as data that can be used for a variety of market analytics, such as customer and competitor analysis, as well as site evaluation.
Business Analyst Data
The app offers global data for 137 countries, such as population, households, purchasing power, age, income, marital status, education and gender. This data is available from three different sources: publicly available data (Census and ACS), Esri’s inhouse data development team and third party vendors. The data included with the extension can be installed in case of working behind a firewall or accessed through ArcGIS Online. Users can create reports based on the data that form part of the extension, as well as infographics, using core functionality of ArcGIS Pro. Additionally, the data can be used as input for a set of geospatial processing tools for doing market analysis, that form part of the application. Aside from the data provided by Esri, users can choose to use their own data for doing market analysis using the Custom Data Setup workflow in the Business Analyst web app.
Business Analyst market analysis tools
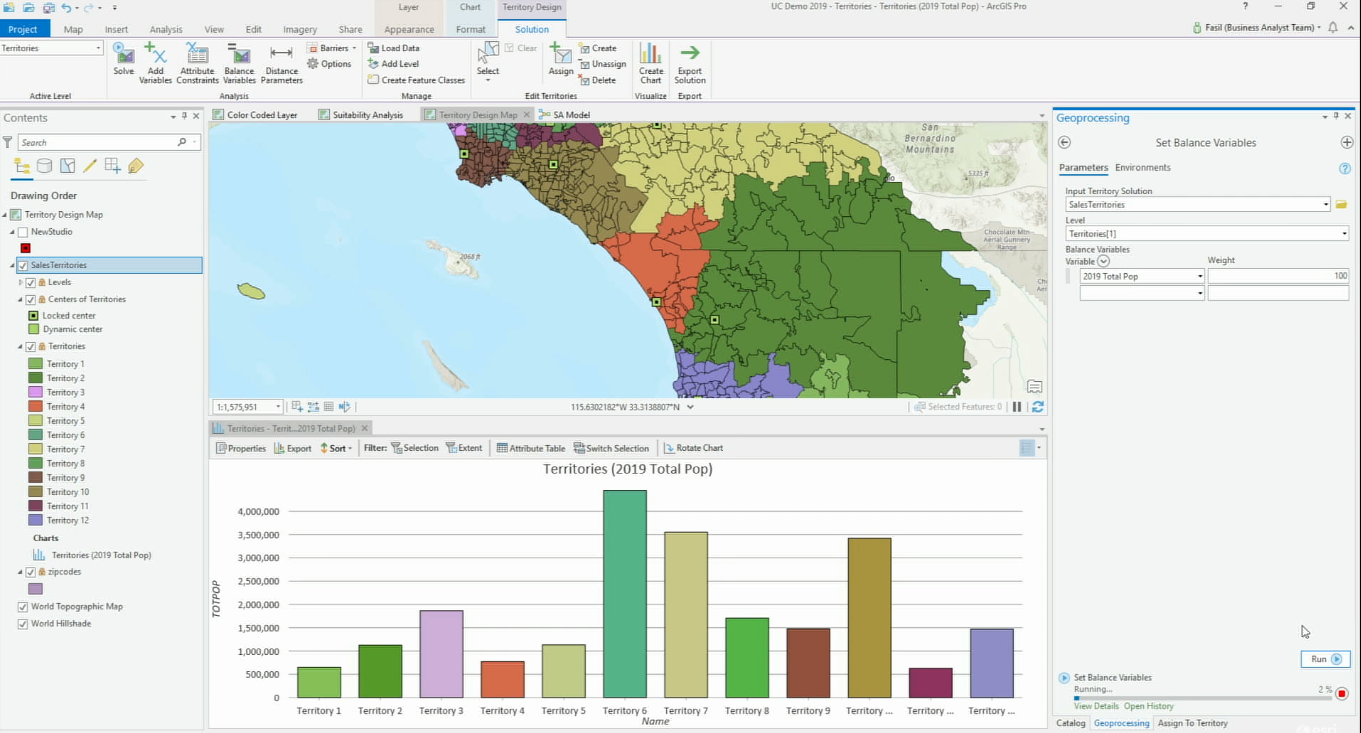
Inside the geoprocessing toolbox overview, a separate Business Analytics toolbox can be found offering the following toolsets: an Analysis toolset, Modeling toolset, Reports toolset, Suitability toolset and Trade Areas toolset. Additionally, there’s also a set of ribbon tools that give access to some of the functionality covered in these toolsets.
The Analysis toolset offers five different tools to analyze demographic attributes of market areas, customer distributions, stores, and facility networks. The idea is to help users target their customers or find new potential locations for stores. For example, the Color Coded layer tool creates a choropleth layer tool from a variable, for example consumer spending inside an area of interest. That area of interest can be divided by the Trade areas toolset (listed below).
The Modeling toolset contains the Huff Model tool for generating market share and sales forecast model outputs.
The Reports toolset generates a tool for creating different reports using the datasets that come with the app or custom data. There are six type of reports available: business, consumer spending, demographics, maps, market potential and tapestry segmentation.
The Suitability analysis toolset offers multiple tools that use a set of user-defined weighted criteria to identify the most suitable site from a set of candidates.
The Trade areas toolset offers multiple tools for building trade or market areas. These can be constructed in different ways, for example based on administrative boundaries or the number of customers that one store attracts.

