In this tutorial, we’ll cover the Field Statistics to Table tool, that gives more flexibility to calculating field statistics from attribute table data.
As the name suggests, the Field Statistics to Table tool creates a standalone table of descriptive statistics for one or more input fields (= columns) in a table or feature class. It was added in Pro 2.9 as users demanded a way to export the Field Statistics when performing data engineering. The data engineering toolset was added to Pro 2.8 to help users explore, visualize, clean, and prepare data.
The new Field Statistics to Table tool is an extension of the data engineering toolset: although it uses the same statistics for each column as in the Data Engineering view, you have now the option to output statistics using only a single field type, or use a Group By Field parameter for the output table, which calculates input field statistics separately for each unique value in the specified field. We’ll have a look at how this works below.
Step 1: Download the data and open a new project in Pro
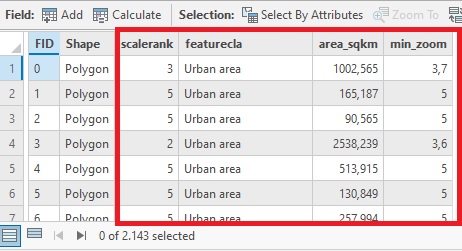
This tutorial uses the same dataset as before, the Natural Earth quick start kit, that can be downloaded here. Create a new, empty project in Pro and add the ne_50m_urban_areas.shp file to your map window, found in the subfolder named “50m_cultural”. The attribute table contains only six columns, but only the last four are used when calculating field statistics. With few columns in our dataset, we can keep things orderly later on. Have a look at the different columns and their data types (one text field with the rest being numerical):
Step 2: Calculate field statistics using Data Engineering toolset
Before we can use the Field Statistics to Table tool, we’ll first have to calculate field statistics for one or more fields using the Data Engineering toolset. This has been covered in an earlier tutorial, found here. Right-click the feature class name (and not the symbology right below) in the Contents pane and select “Data Engineering”, right below “Attribute Table”. You will now see all field names listed vertically on the left of a new pane, with an empty statics panel on the right. Select all fields by clicking a single field name on the left, and press Ctrl + A or use the Shift key with the mouse and clicking the first and last Field names. With all fields selected (these should now be blue after selecting them), drag them all to the Statistics panel to the right and click “Calculate”.
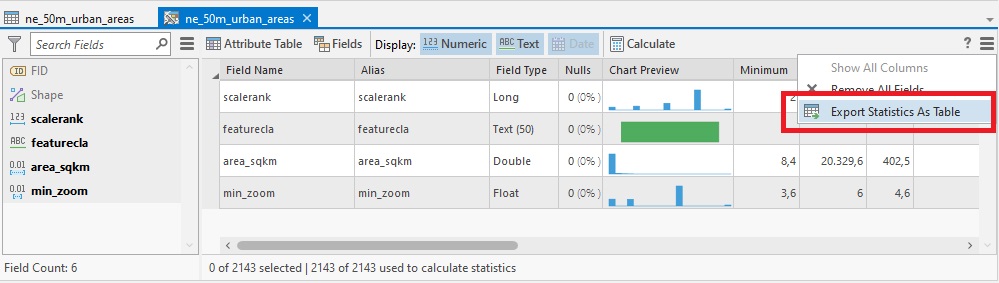
Field statistics are now being calculated for each field: because we have only four different column names in our attribute table, we see only four rows in the statistics panel. Now that we have the field statistics available for each field, we can use the new Export Statistics as Table tool. The tool is found in the hamburger menu in the top-right of the statistics panel. Click the menu button indicated in the image below:
Step 3: Export Statistics as Table
The Export Statistics tool opens automatically after clicking it. We first need to select an input feature class or table, and select the fields we want to calculate the field statistics for. Basically, we are now replicating the same procedure as performed under step 2, but with added options. To recreate the statistics pane for all four fields displayed above, leave all tool parameters unchanged, and choose “all” under Output Table Field Types.
The Output Table Field Types tool parameter refers to different output statistics used for the individual field statistics displayed at the end of the tool. They are explained in detail, along with a handy table in the tool reference online: selecting on or another changes the way that the tool displays each output statistic. For example, when choosing “all” under Field Types, the Minimum statistic field will be a Text field in the tool output, but it will change to “Double” when choosing “Numeric”. Click OK to run the tool (an example of different field types for one and the same output statistic is shown under Step 4).
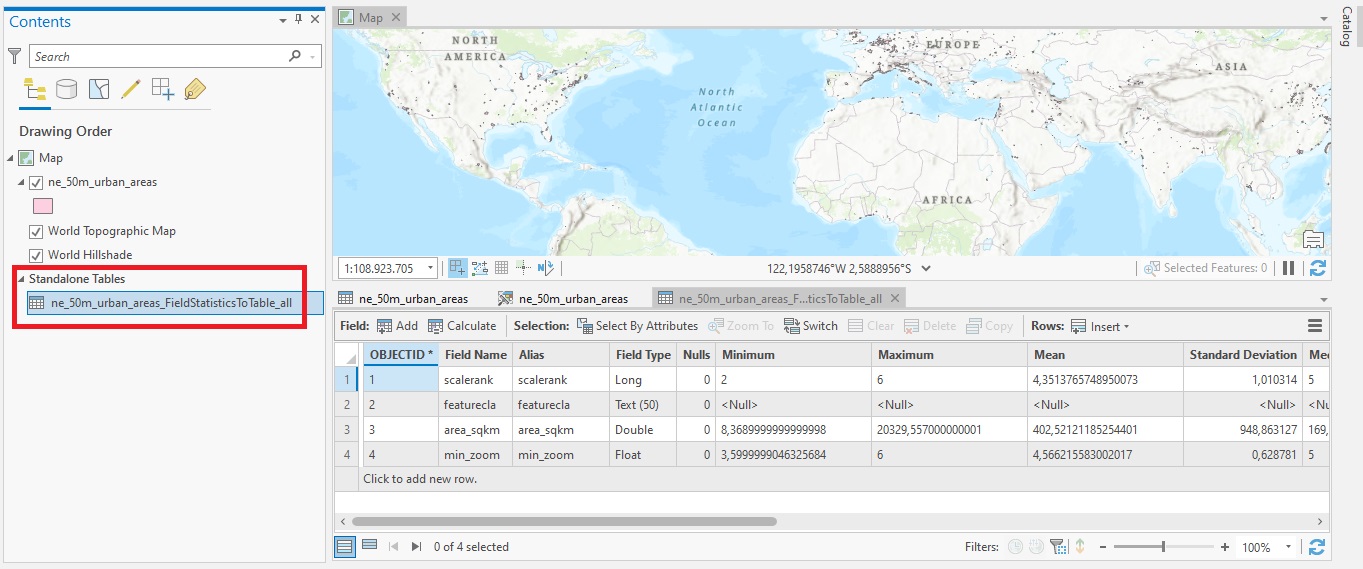
Running the tool will output all four field types and create a standalone table that is added to the Contents pane and, once opened, shows the exact same columns from in the Statistics pane above, minus the chart preview (compare with the image above):
The other two options under Output Tables Field Types are “text” and “numerical” (the date options is not available here as we don’t have any date fields in our attribute table). When choosing “text” for the output table, it will only contain the field named “featurecla” as it’s the only text field in our dataset, while choosing “numerical” will only show the numerical fields “scalerank”, “area_sqkm” and “min_zoom”.
Step 4: Create Field Statistics using the Group by Field option
Click the Ne_50m_urban_areas again to display the Statistics pane and open the Export Statistics to Table tool again. Now, select “scalerank” under the Group By Field option and click OK to run the tool. Select “All” under Output Tables Field Types and click “OK” to run the tool.
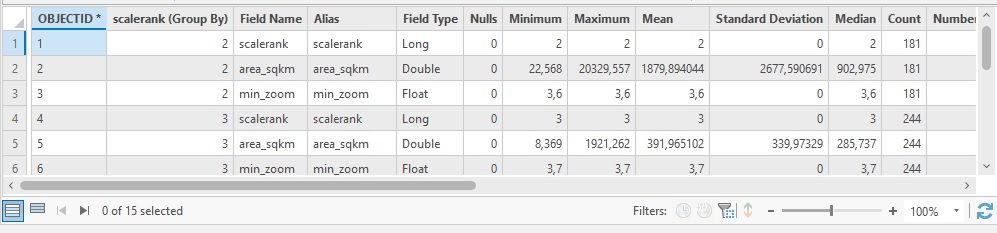
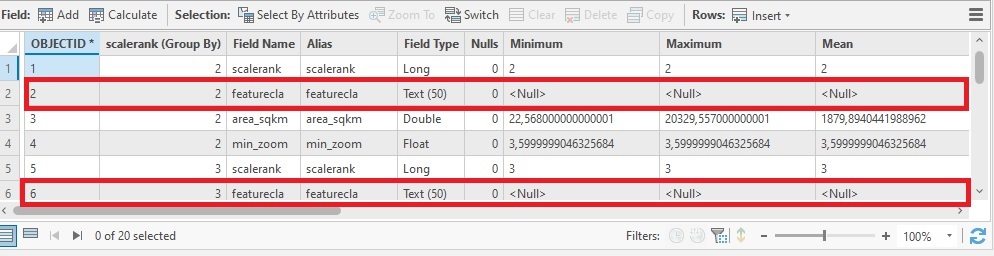
The output table shows field statistics for all unique field values of the scalerank field (these values are 2, 3, 4, 5, 6, as displayed in the “scalerank (group by)” field. The individual field statistics per row refer to the field name. As you can see, row 2 and 6 contain <null> values as they both refer to the “featurecla” field, which is a text value from which no statistical values can be derived:
To improve this table, we can run the tool again using the same Group By Field option as before, but this time using only numerical field types for the output table field types. The output shows meaningful field values without any <Null> fields: