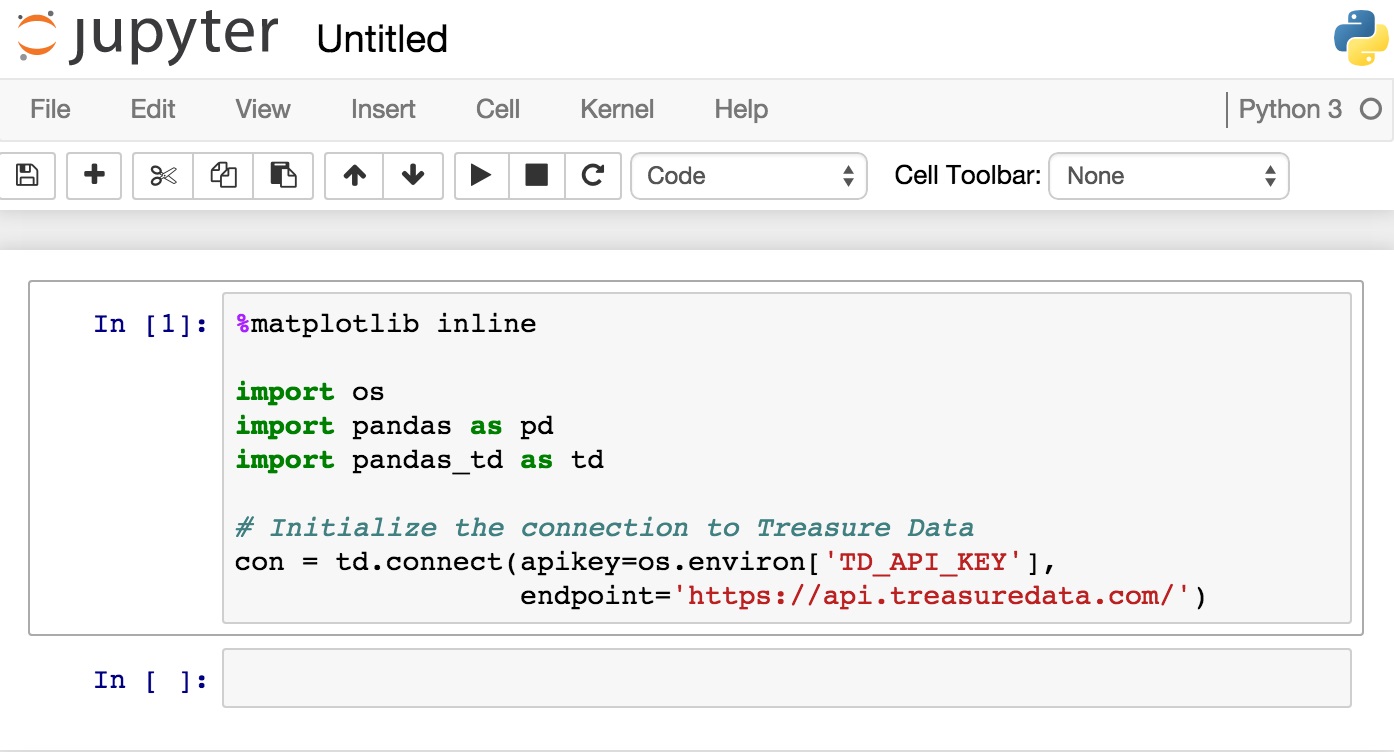
Esri has adopted the Jupyter Notebook App through Anaconda, which is now shipped with ArcGIS Pro. It is an ideal working environment for ArcGIS Pro users working with Python 3, as well as the ArcGIS API for Python.
Server-client application
The Jupyter Notebook App is a server-client application that allows editing and running notebook documents via a web browser. Notebook documents (or simply “notebooks”) are documents produced by the Jupyter Notebook App, which contain both computer code (such as Python) and rich text elements in the form of paragraph, equations, figures and links. Notebook documents are both human-readable documents containing the analysis description and the results as well as executable documents which can be run to perform data analysis. They look like a combination of Word and Excel files containing code, text in images that are displayed in a web browser. Notebooks can be saved in a variety of file formats and shared with others – if you open a notebook file in a text editor you will recognize the JSON file format structure.
Getting started
A new notebook can be created by clicking the Jupyter Notebook icon on the Windows task bar or open a command prompt window and type “jupyter notebook” and hit “Enter”. A notebook server will then start up from the command prompt. It is recommended to leave this server connection running as it functions as your connection to your notebooks. A browser window will open up automatically with a local server address. Depending on your setup, you will see your local folder structure. Choose “new -> Notebooks Python 3” on the right of your screen for opening a blank notebook. A notebook contains cells that can consist of multiple lines. You can add new cells at will and assign different types to each (such as a code or non-code cell). The code in a cell can be executed separately, the results will be displayed in a separate cell below. If the code in the cell doesn´t produce the expected results, you can simply adjust your code and run the cell again – the results will overwrite earlier output – a nice feature that IDEs lack.
Greater flexibility for streamlining GIS workflows
It is the combination of different elements that makes Jupyter unique and popular: GIS users can streamline Python workflows and distribute their code through independent cells that notebooks offer. This allows them to isolate parts of an application, run separate code blocks and even change the order in which code parts are run – offering greater flexibility to the user. The running order of separate code cells can be tracked easily by consulting the number on the left of each cell.
Graphically, notebooks have more to offer than IDEs, for example by using markdown in a cell that gets translated to HTML in the web browser to explain what´s going on in your notebook. You can use HTML such as <b></b>, or different header sizes for layout purposes. This is not all: Panda data frames have a nice cell layout can be visualize directly inside of a notebook. In addition to this, these data frames offer a better performance than arcpy´s search and update cursors. By using the ArcGIS Python API with notebooks, you can even use map views in your cells. This looks very similar to using R as a GIS: a programming interface combined with a mapping interface.
Bash and magic commands
Jupyter Notebooks have unique functionality not available through IDEs. For example, they allow you to run Bash commands that are normally used from a command prompt. This can be done by using an exclamation mark, for example “!pip list” or “!pip install …”. Last but not least, it´s worth noticing so-called “magic commands” that extend the core language with useful shortcuts. These are divided into line and cell magics. A full list can be printed by typing “%lsmagic” into an empty cell and run the code by hitting shift+enter. One example from this list is “%matplotlib inline”, which allows inline display of matplotlib graphics. Running this command is required before running any Python code that uses the matplotlib library (this rule does not apply for panda data frames, however).
Autocompletion, Help and Method signature
Notebooks can be used as IDEs in the sense that they offer autocompletion and help functions. Autocompletion works a little different than with in IDE as you have to call it actively, whereas an IDE calls it automatically for you; inside a notebook, you place a period after the Python object of your choice, and then place a TAB. A list of available options will appear. The Help function is similar to R, which can be called by placing a question mark, followed by the function or method of your choice. The Help info will be displayed in an red outlined cell below the current one. Use shift+tab to see a signature of a method that shows what arguments you can pass for a given method.
For more information, have a look at: http://jupyter.org/

