

For more information on ArcGIS Pro please consider our classes: Mastering ArcGIS Pro 3: Maps, Layers, Projects, and Layouts and Mastering ArcGIS Pro 3: Editing, Analysis, and Automation.
Graphics layers in ArcGIS Pro allow you to overlay elements like text, shapes, and symbols on your map, enhancing its visual appeal without altering your data. You can also add simple geometric shapes—rectangles, circles, lines, or points—or they can be complex polygons, linear or curved text, or images. These layers are especially useful for presentations, annotations, and highlighting areas of interest. They provide flexibility for temporary markups or additional information without affecting the map’s core structure.
Key Features:
- Customizable: Modify colors, shapes, and styles for specific needs.
- Layer Ordering: Organize layers to maintain visual clarity.
- Interactive Editing: Move, resize, or delete elements as necessary.
When to Use Graphics Layers Effectively:
- Presentations and Storytelling: Graphics layers are ideal for marking up maps during presentations, allowing you to highlight key areas, add notes, or direct attention to specific map features.
- Temporary Markups: Collaborators or reviewers can use graphics layers to add comments or suggestions without altering permanent layers.
- Map Enhancements: Add legends, titles, arrows, or callouts for extra information or context that doesn’t belong in the map’s attribute data.
- Instructional or Training Maps: For teaching GIS, graphics layers help explain specific areas, making it easier for students or clients to follow along.
How to Add a Graphics Layer to a Map in ArcGIS Pro
To begin using graphics layers, you first need to add one to your map. Here’s how:
- Open Your Project and Map: Start by opening your map project in ArcGIS Pro.
- Open or Create a Map: This will serve as the container for the graphics layer.
- Insert Graphics Layer:
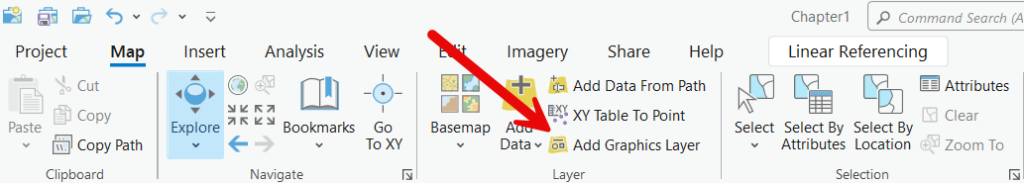
- Go to the Map tab in the main menu.
- Click Add Graphics Layer. This will add the graphics layer to your map, and it will appear in the Contents pane.
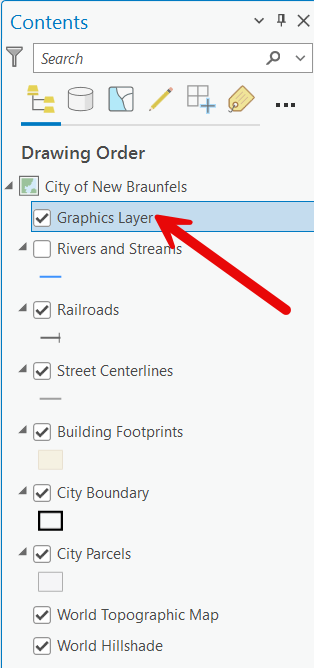
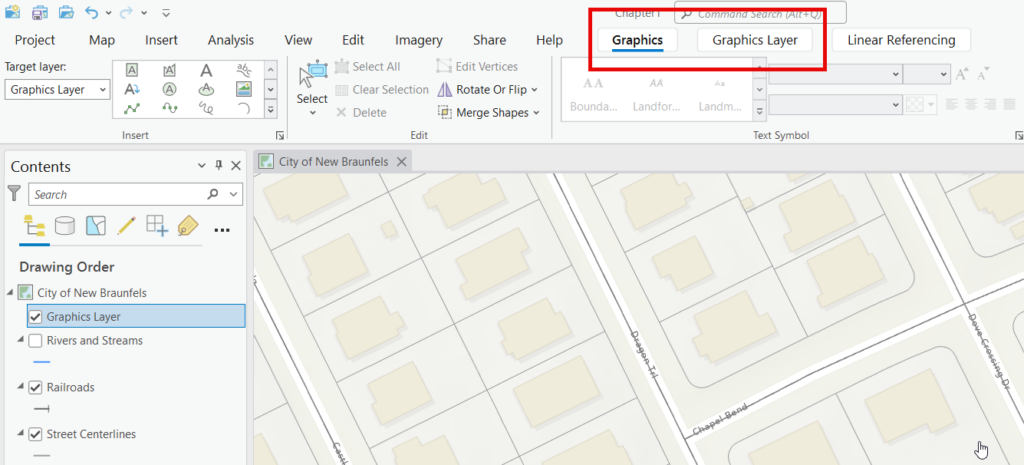
This will add two contextual tabs to the ArcGIS Ribbon: Graphics and Graphics Layer.
- Drawing Graphics:
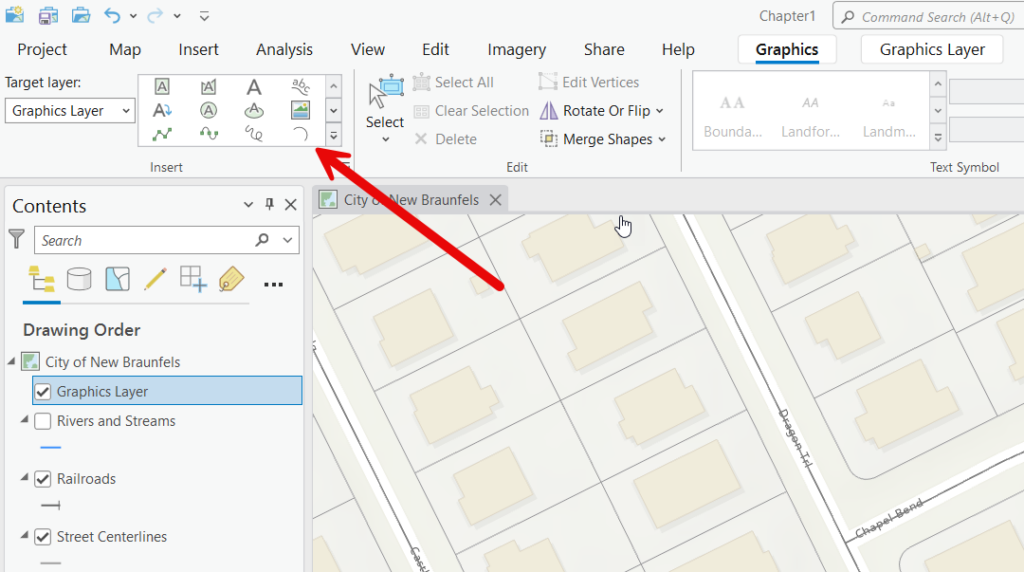
- Once the layer is added, use the Graphics tools to draw shapes, lines, or text directly on the map. These tools can be found on the Graphics context tab under the Insert section.
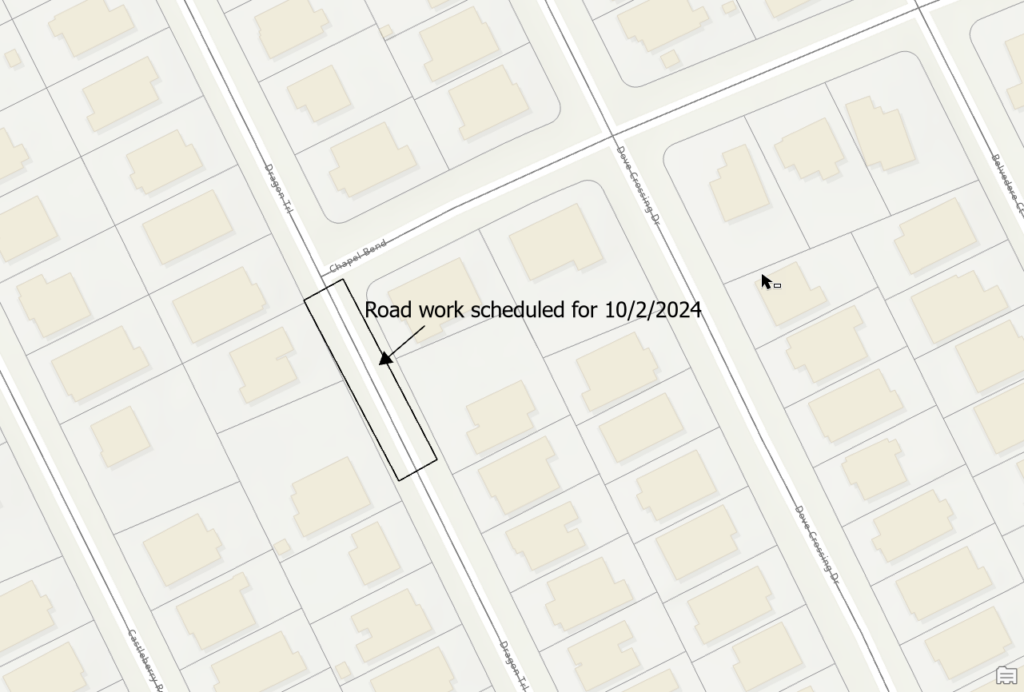
 You can see an example of content that has been added to a graphics layer in the screenshot below where I’ve added a polygon, text, and an arrow.
- Once the layer is added, use the Graphics tools to draw shapes, lines, or text directly on the map. These tools can be found on the Graphics context tab under the Insert section.
- Customize the Appearance:
- Adjust color, transparency, size, and style using the Symbology pane for each graphic element you add.
- Managing the Graphics Layer
- The Graphics Layer context tab can be used to manage a variety of visualization settings for the layer including setting a visibility scale range, transparency, symbology, and others.
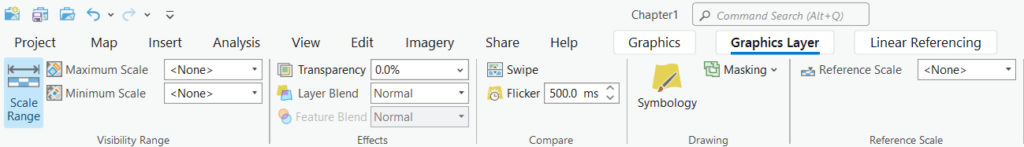
- The Graphics Layer context tab can be used to manage a variety of visualization settings for the layer including setting a visibility scale range, transparency, symbology, and others.
- Customize the Appearance:
- Right click a graphic and select Properties to display a pane for altering the appearance of graphics that have been added to a graphics layer.
Adjust color, transparency, size, and style using the Element pane for each graphic element you add.
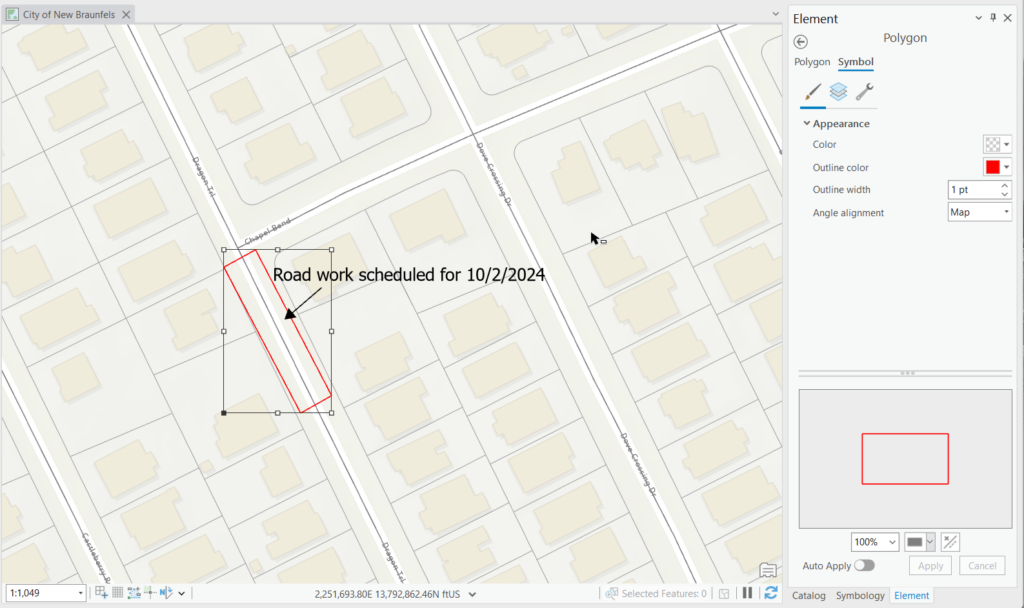
- Right click a graphic and select Properties to display a pane for altering the appearance of graphics that have been added to a graphics layer.
Limitations of Graphics Layers in ArcGIS Pro
While graphics layers are useful for adding a variety of elements, they have some limitations compared to traditional data layers:
- No Attribute Data: Graphics layers are purely visual and don’t contain attribute tables or data fields like feature layers do.
- Non-Spatial: You can’t perform spatial analysis (e.g., buffer, clip, intersect) on graphics layers.
- No Editing Tools: Advanced editing tools, like snapping or topology, aren’t available for graphics layers.
Graphics layers are ideal for temporary annotations and simple visual enhancements but lack the robust capabilities of other layers in ArcGIS Pro.
Best Practices for Using Graphics Layers
- Keep It Simple: Overcrowding your map with too many graphics can make it hard to read. Focus on the essential elements you want to highlight.
- Consistent Use of Colors: Stick to a consistent color scheme to ensure your graphics stand out but don’t overpower the map.
- Organize Layers: Label your graphics layers clearly and place them in the correct order in the Contents pane to maintain a clean and professional look.
Conclusion
Graphics layers in ArcGIS Pro are a powerful tool for enhancing map presentations, marking up maps for review, and adding extra visual elements without altering underlying data. Whether you are telling a story, teaching GIS, or collaborating on map reviews, graphics layers offer a flexible, dynamic way to communicate spatial information clearly and effectively.
For more information on ArcGIS Pro please consider our classes: Mastering ArcGIS Pro 3: Maps, Layers, Projects, and Layouts and Mastering ArcGIS Pro 3: Editing, Analysis, and Automation.
