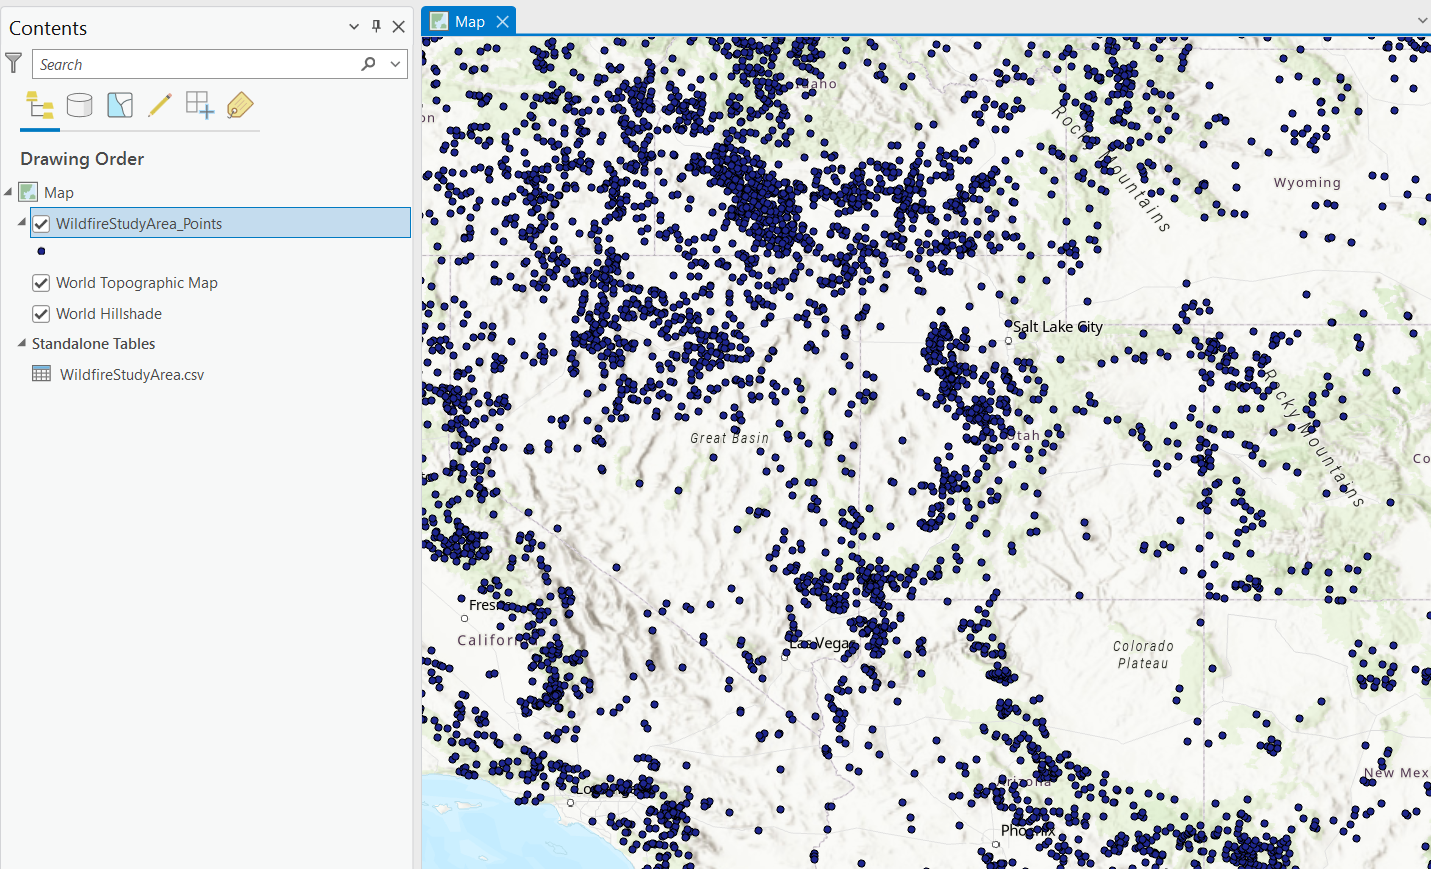
ArcGIS Pro allows you to import spatial data from a variety of sources, including spreadsheets. A common task is adding a point layer using data from an Excel spreadsheet or CSV file that contains columns for X (longitude) and Y (latitude) coordinates. This tutorial will guide you through the process step-by-step, helping you visualize your spreadsheet data directly on the map.
Note: This tutorial was written using ArcGIS Pro 3.3.1. If you are using a different version of ArcGIS Pro the workflow may not be the same.
Step 1: Prepare Your Spreadsheet Data
Before you import your data into ArcGIS Pro, ensure your spreadsheet is correctly formatted:
- Format Your Data:
- Your spreadsheet should contain two essential columns: one for X coordinates (longitude) and one for Y coordinates (latitude). Label these columns clearly, for example,
LongitudeandLatitudeorXandY. Below is an example CSV format spreadsheet containing wildfire data with columns for Latitude and Longitude.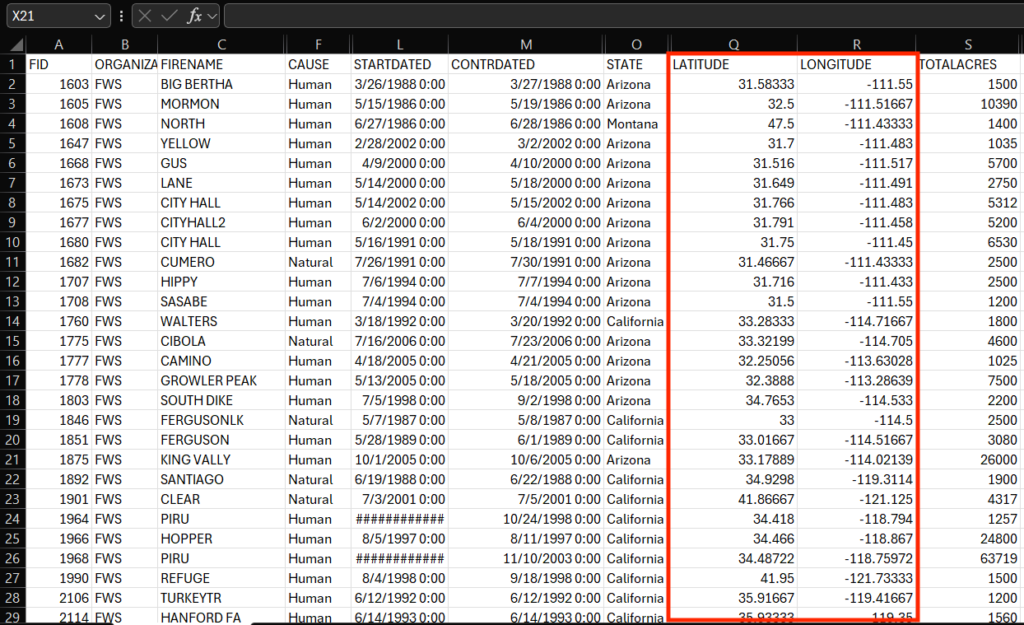
- Ensure the coordinate values are in decimal degrees if using latitude and longitude. For other coordinate systems, ensure you know the projection details.
- Your spreadsheet should contain two essential columns: one for X coordinates (longitude) and one for Y coordinates (latitude). Label these columns clearly, for example,
- Save Your File:
- Save your spreadsheet as an Excel file (.xlsx) or CSV (.csv) format. If you’re using Excel, make sure the data is in the first worksheet since ArcGIS Pro reads data from the first worksheet by default.
Step 2: Open ArcGIS Pro and Create (or Open) a New Project
- Launch ArcGIS Pro:
- Open ArcGIS Pro and create a new project or open an existing project where you want to add the point layer.
- Open a New Map:
- If you haven’t already, add a new map by clicking Insert > New Map. This will create a base map where your points will be displayed.
Step 3: Add the Spreadsheet Data to the Map
- Add Data:
- Go to the Map tab on the ribbon, and click on Add Data.
- Browse for Your Spreadsheet:
- Navigate to the location of your Excel file or CSV and select it. Click OK to add it to your project. The table will now appear in the Contents pane under Standalone Tables.
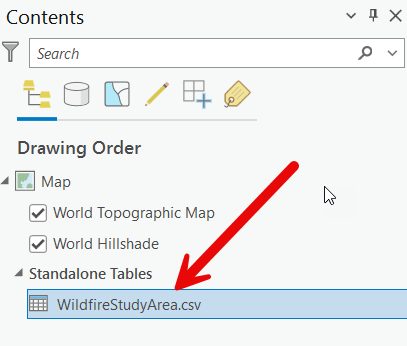
- Navigate to the location of your Excel file or CSV and select it. Click OK to add it to your project. The table will now appear in the Contents pane under Standalone Tables.
Step 4: Display X and Y Data as Points
- Display XY Data Geoprocessing Tool:
- Right-click on your added table in the Contents pane and select Create Points from Table and then XY Table to Point.
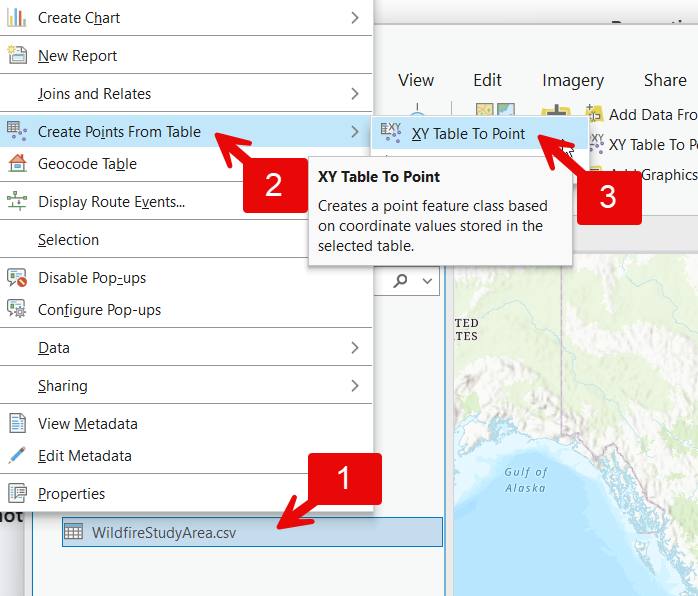
This will display the XY Table to Point geoprocessing tool.
- Right-click on your added table in the Contents pane and select Create Points from Table and then XY Table to Point.
- Set X and Y Coordinates:
- In the XY Table to Point window:
- Set the X Field to the column containing your longitude values (e.g.,
LongitudeorX). - Set the Y Field to the column containing your latitude values (e.g.,
LatitudeorY).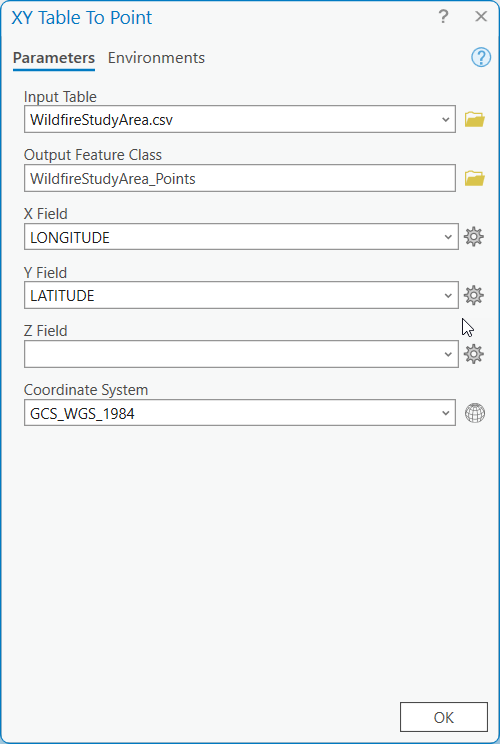
- Set the X Field to the column containing your longitude values (e.g.,
- In the XY Table to Point window:
- Coordinate System:
- Ensure the Coordinate System matches the coordinate system of your data (e.g., WGS 1984 for standard latitude and longitude).
- Run the Tool:
- Click Ok to generate the point layer. Your data points will now appear on the map.
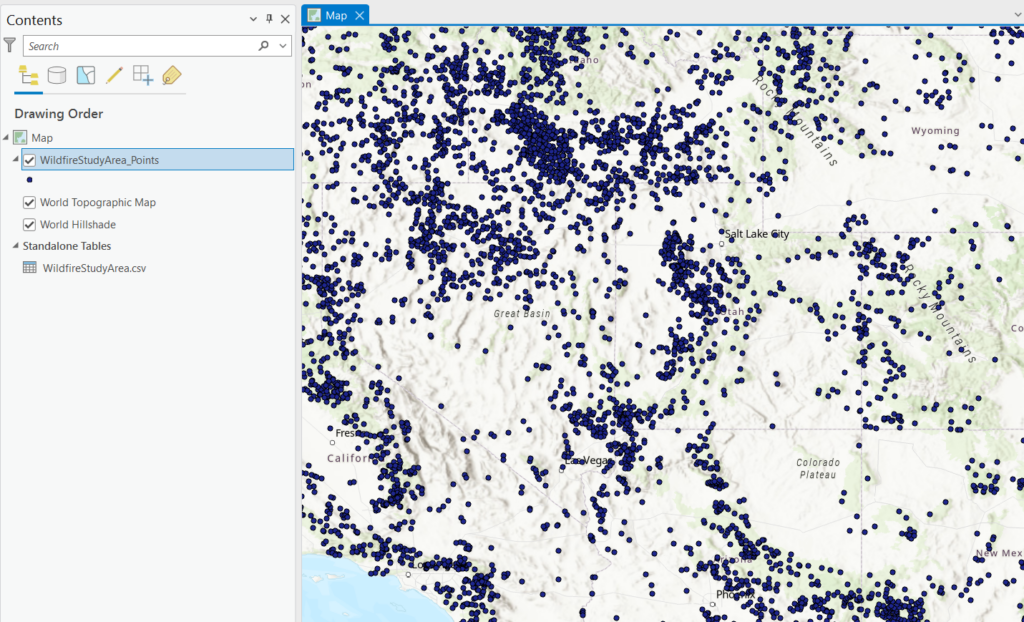
- Click Ok to generate the point layer. Your data points will now appear on the map.
Step 5: Style Your Layer (optional)
- Style Your Points:
- To make your points visually stand out, you can change the symbology by left-clicking on your new point layer to display the Symbology Pane, and customizing the color, size, and shape.
Conclusion
Adding point layers from spreadsheet data in ArcGIS Pro is a powerful way to visualize location-based information quickly and efficiently. By following these steps, you can easily convert raw coordinate data into meaningful spatial insights. Whether you’re mapping customer locations, survey points, or any other geospatial data, this method offers a straightforward path from table to map.
For more detailed information and additional customization options, refer to the ArcGIS Pro official documentation.
Happy mapping!

