Consulting Services
We offer a variety of GIS services to help you achieve your business goals. Our leadership team and associate staff members will work with you to ensure that your project is successful from the ground up. The information below provides some basic descriptions of our primary service offerings. For more information, contact us at sales at geospatialtraining.com.
Application Development with Experience Builder
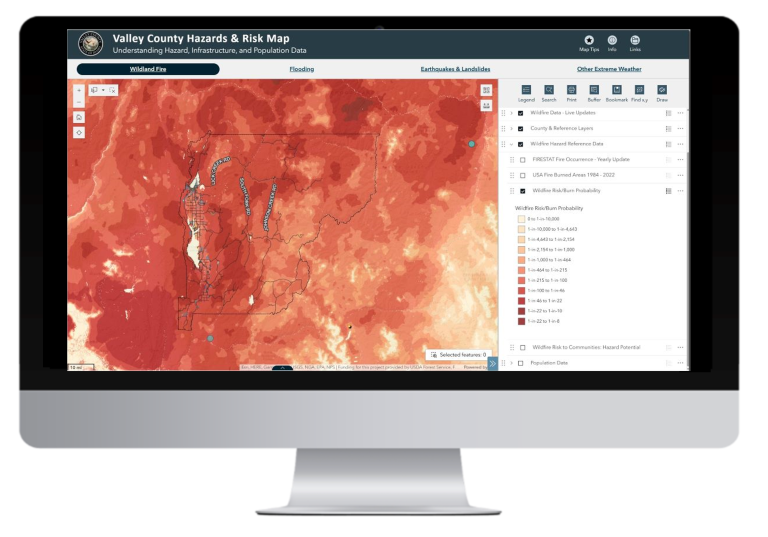
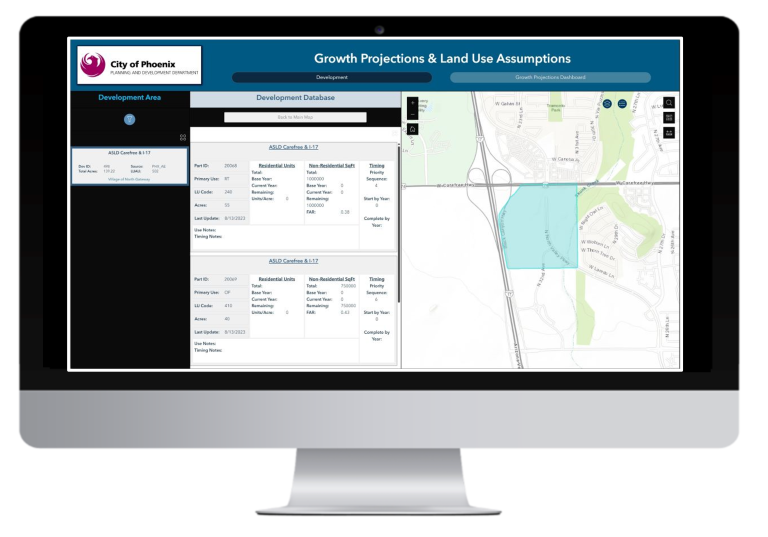
Geospatial Training Services develops user-friendly GIS web, mobile, and desktop applications that make sharing, collecting, and using information easier. Our products are intuitive and designed to ensure that users can leverage GIS capabilities without requiring extensive GIS or database expertise.
As consultants at the forefront of Experience Builder’s evolution, we specialize in designing and configuring a wide range of applications, including interactive dashboards, data collection tools, decision-support systems, and real-time monitoring solutions. Whether clients need a streamlined mapping interface, a dynamic reporting platform, or a custom workflow application, we tailor each solution to their specific needs.
Beyond development, we offer ongoing maintenance or empower clients with the knowledge to manage their applications independently through hands-on training. Our expertise ensures that organizations can fully harness Experience Builder’s capabilities for smarter, more efficient GIS solutions.
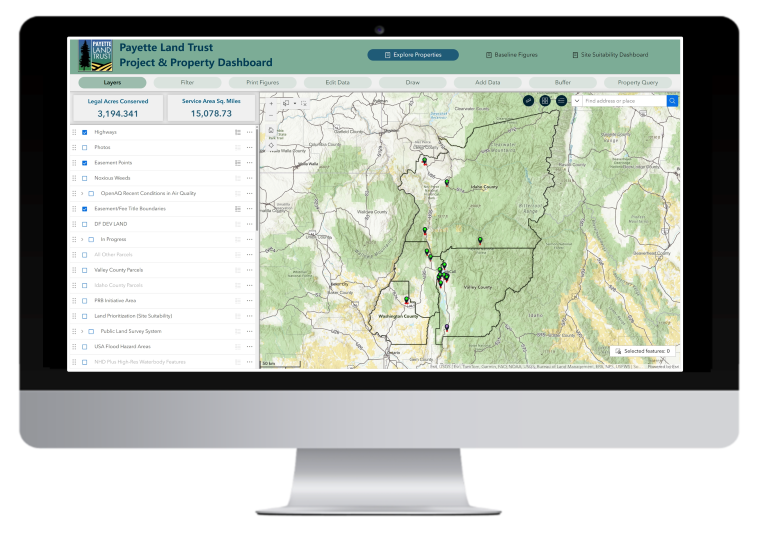
Payette Land Trust Project Dashboard
This project dashboard is an example of how incredibly dynamic Experience Builder applications can be. The application allows Land Trust staff to view their own assets and images alongside authoritative reference data from other agencies and stakeholders. It also incorporates information to help them streamline and prioritize their workflows.
The layout was configured to allow for an uncluttered, but highly dynamic interface where a specific function will not appear unless the user wishes to interact with it. A menu allows the user to open the following functions in the left-hand panel:
- Layer List
- Filter
- Edit Data
- Draw
- Add Data
- Buffer
- Property Query
Custom Application and Dashboard Development
We can build applications in the no-code ArcGIS Online environment or utilize Programming for heavier customization. Our developers are experienced with the latest development technologies including:
- ArcGIS Online Applications and Dashboards
- JavaScript
- ArcGIS Server and the JavaScript API
- Dojo, jQuery, Node, Angular, Bootstrap, Backbone
- Python
- R
- .NET with ArcObjects
- Google Maps API, OpenLayers, Carto API
- HTML5 and CSS3

Real Time and Historical Wildfire Analysis Application
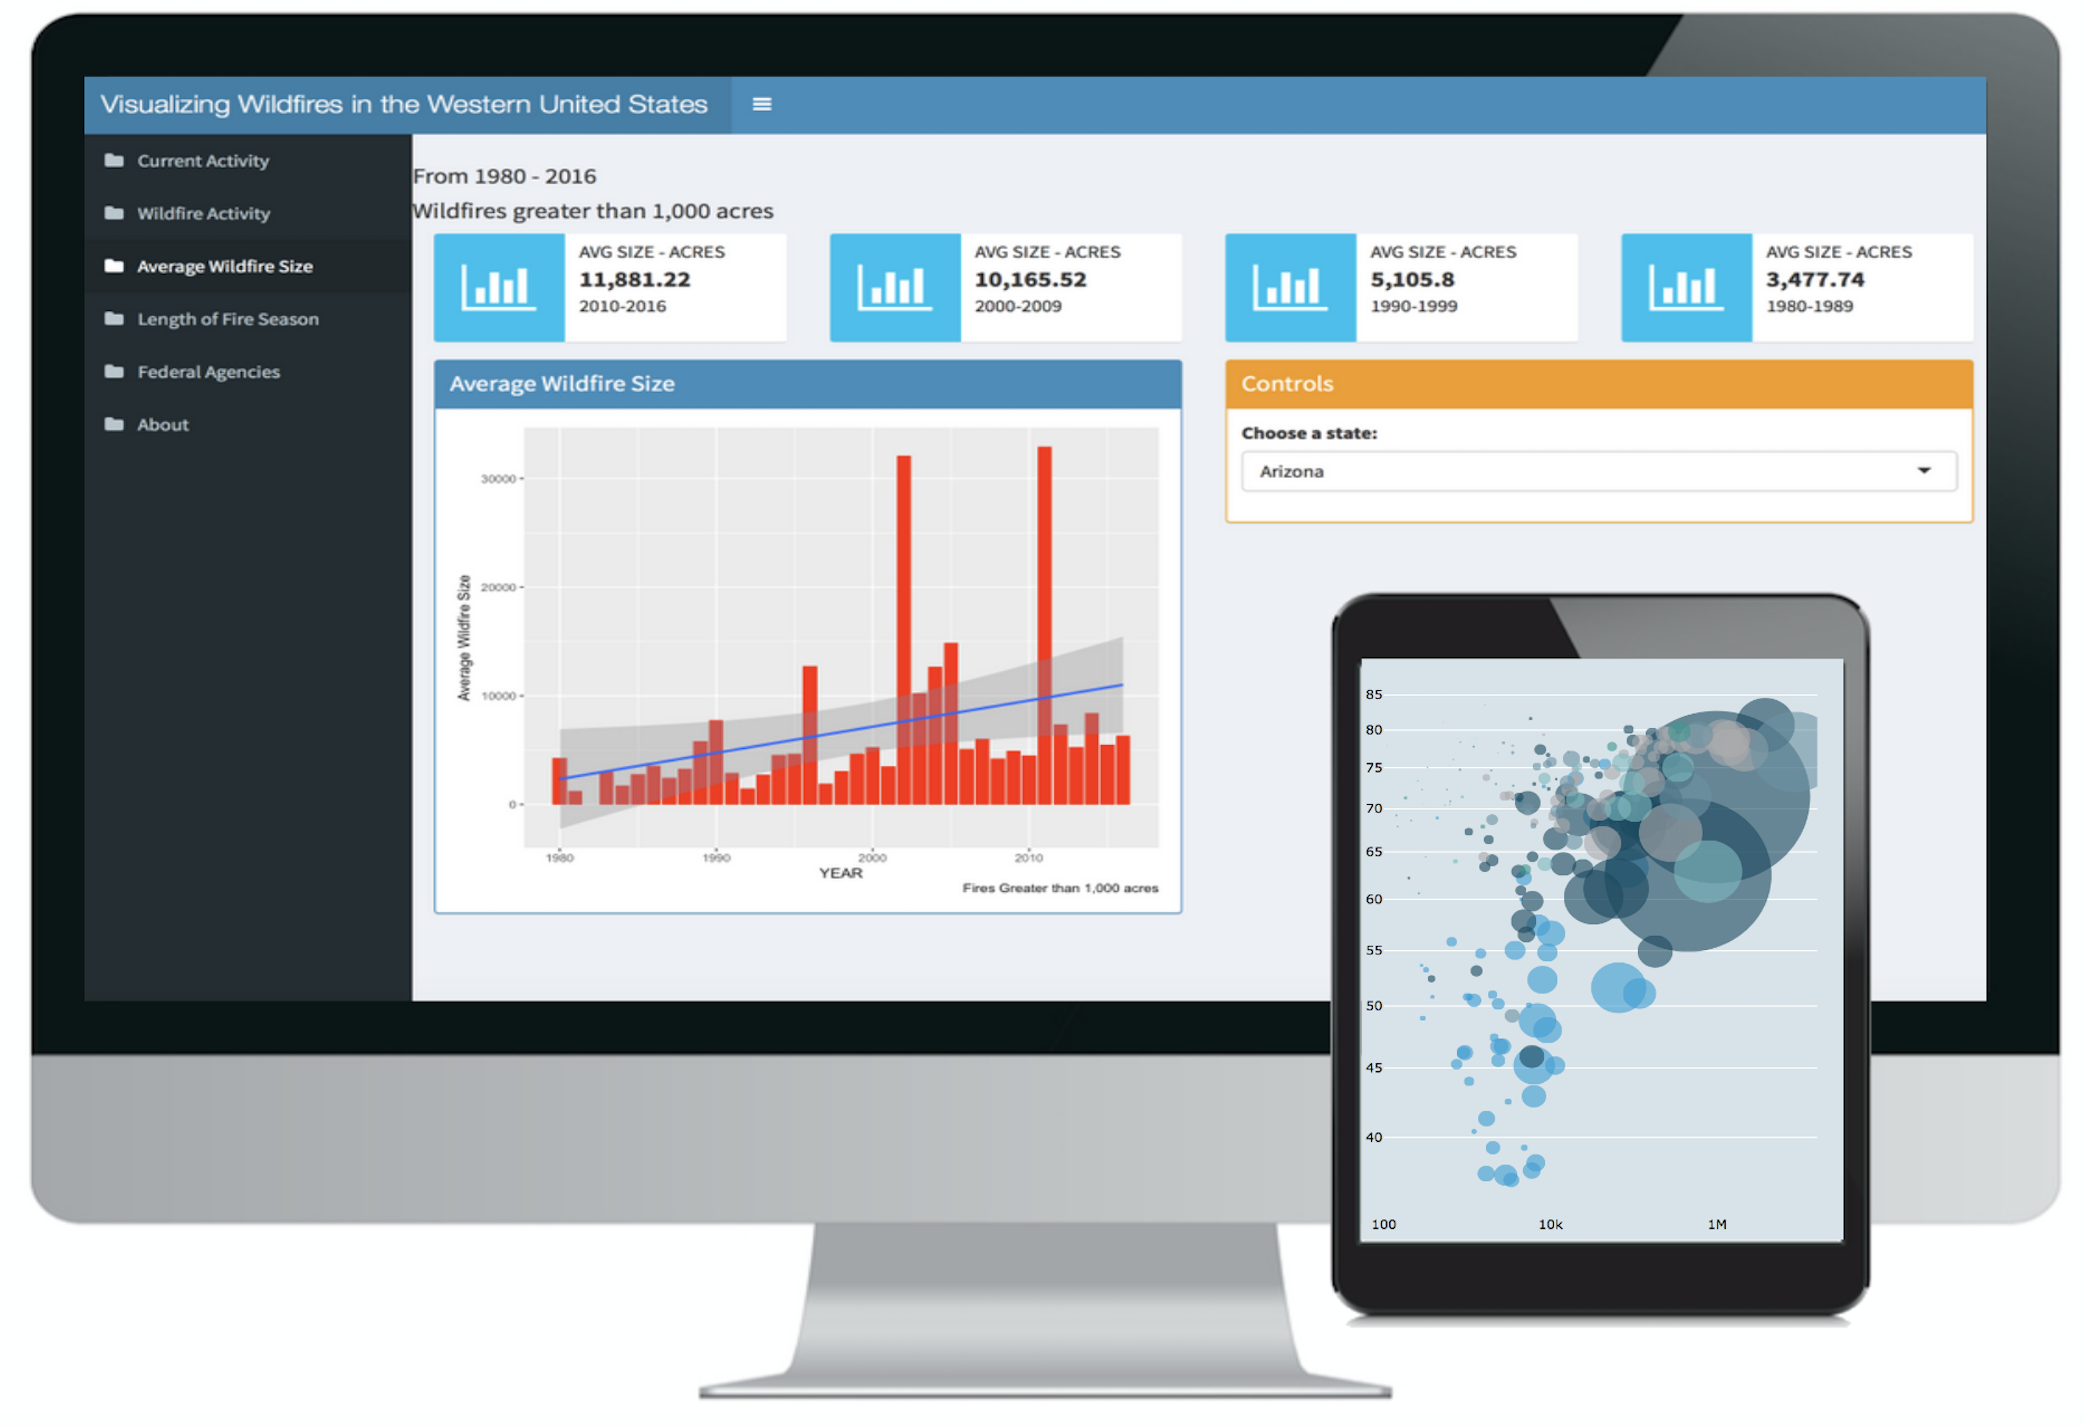
Using the Federal Wildland Fire Occurrence Database along with current wildfire activity information provided by Inciweb and drought information provided by the University of Nebraska, we developed an interactive web application for visualizing wildfire activity in the western United States.
The application includes a number of panels including a map of current wildfires and drought conditions, historical information by state for total acreage burned, number of wildfires, average wildfire size by state and decade, length of fire season, and acreage burned by federal agency.
We used the R programming language with Shiny to create this application.
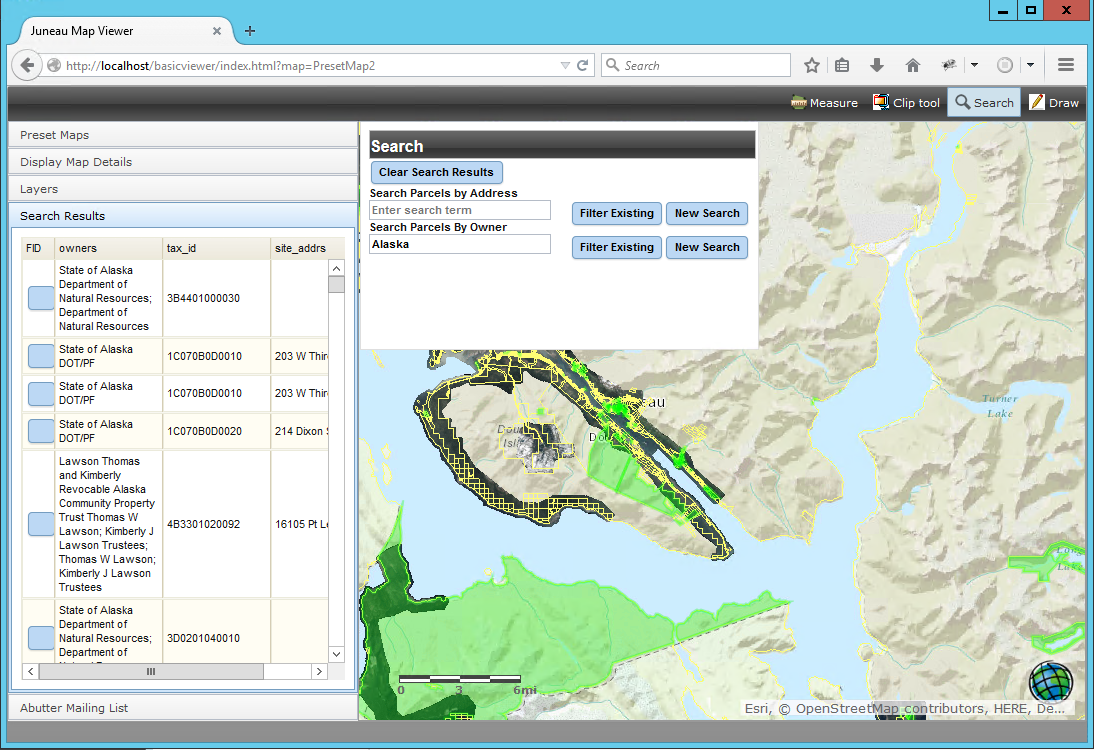
City of Juneau, AK Parcel Viewer
We developed a parcel map viewing application for the City of Juneau, Alaska that allows internal and external users to view imagery, streets, parcel boundaries, property structures, and cell phone towers. In addition, the application includes functionality for measuring, printing, redlining, searching for properties, and generating a property mailing list based on spatial relationships.
The mailing list generator allows the end user to select a property type (parcel, condo, or manufactured home), buffer distance, and point of origin as input used to generate a mailing list and map.
City of Juneau, AK Parcel Vieweris a free online application that shows an aerial view of Juneau with all parcels outlined in yellow. These boxes are interactive, show property lines, the landowner, zoning, assessed value, topography, and more. We used the ArcGIS API for JavaScript with ArcGIS Server to build the application.
Spatial and Geostatistical Analysis and Modeling
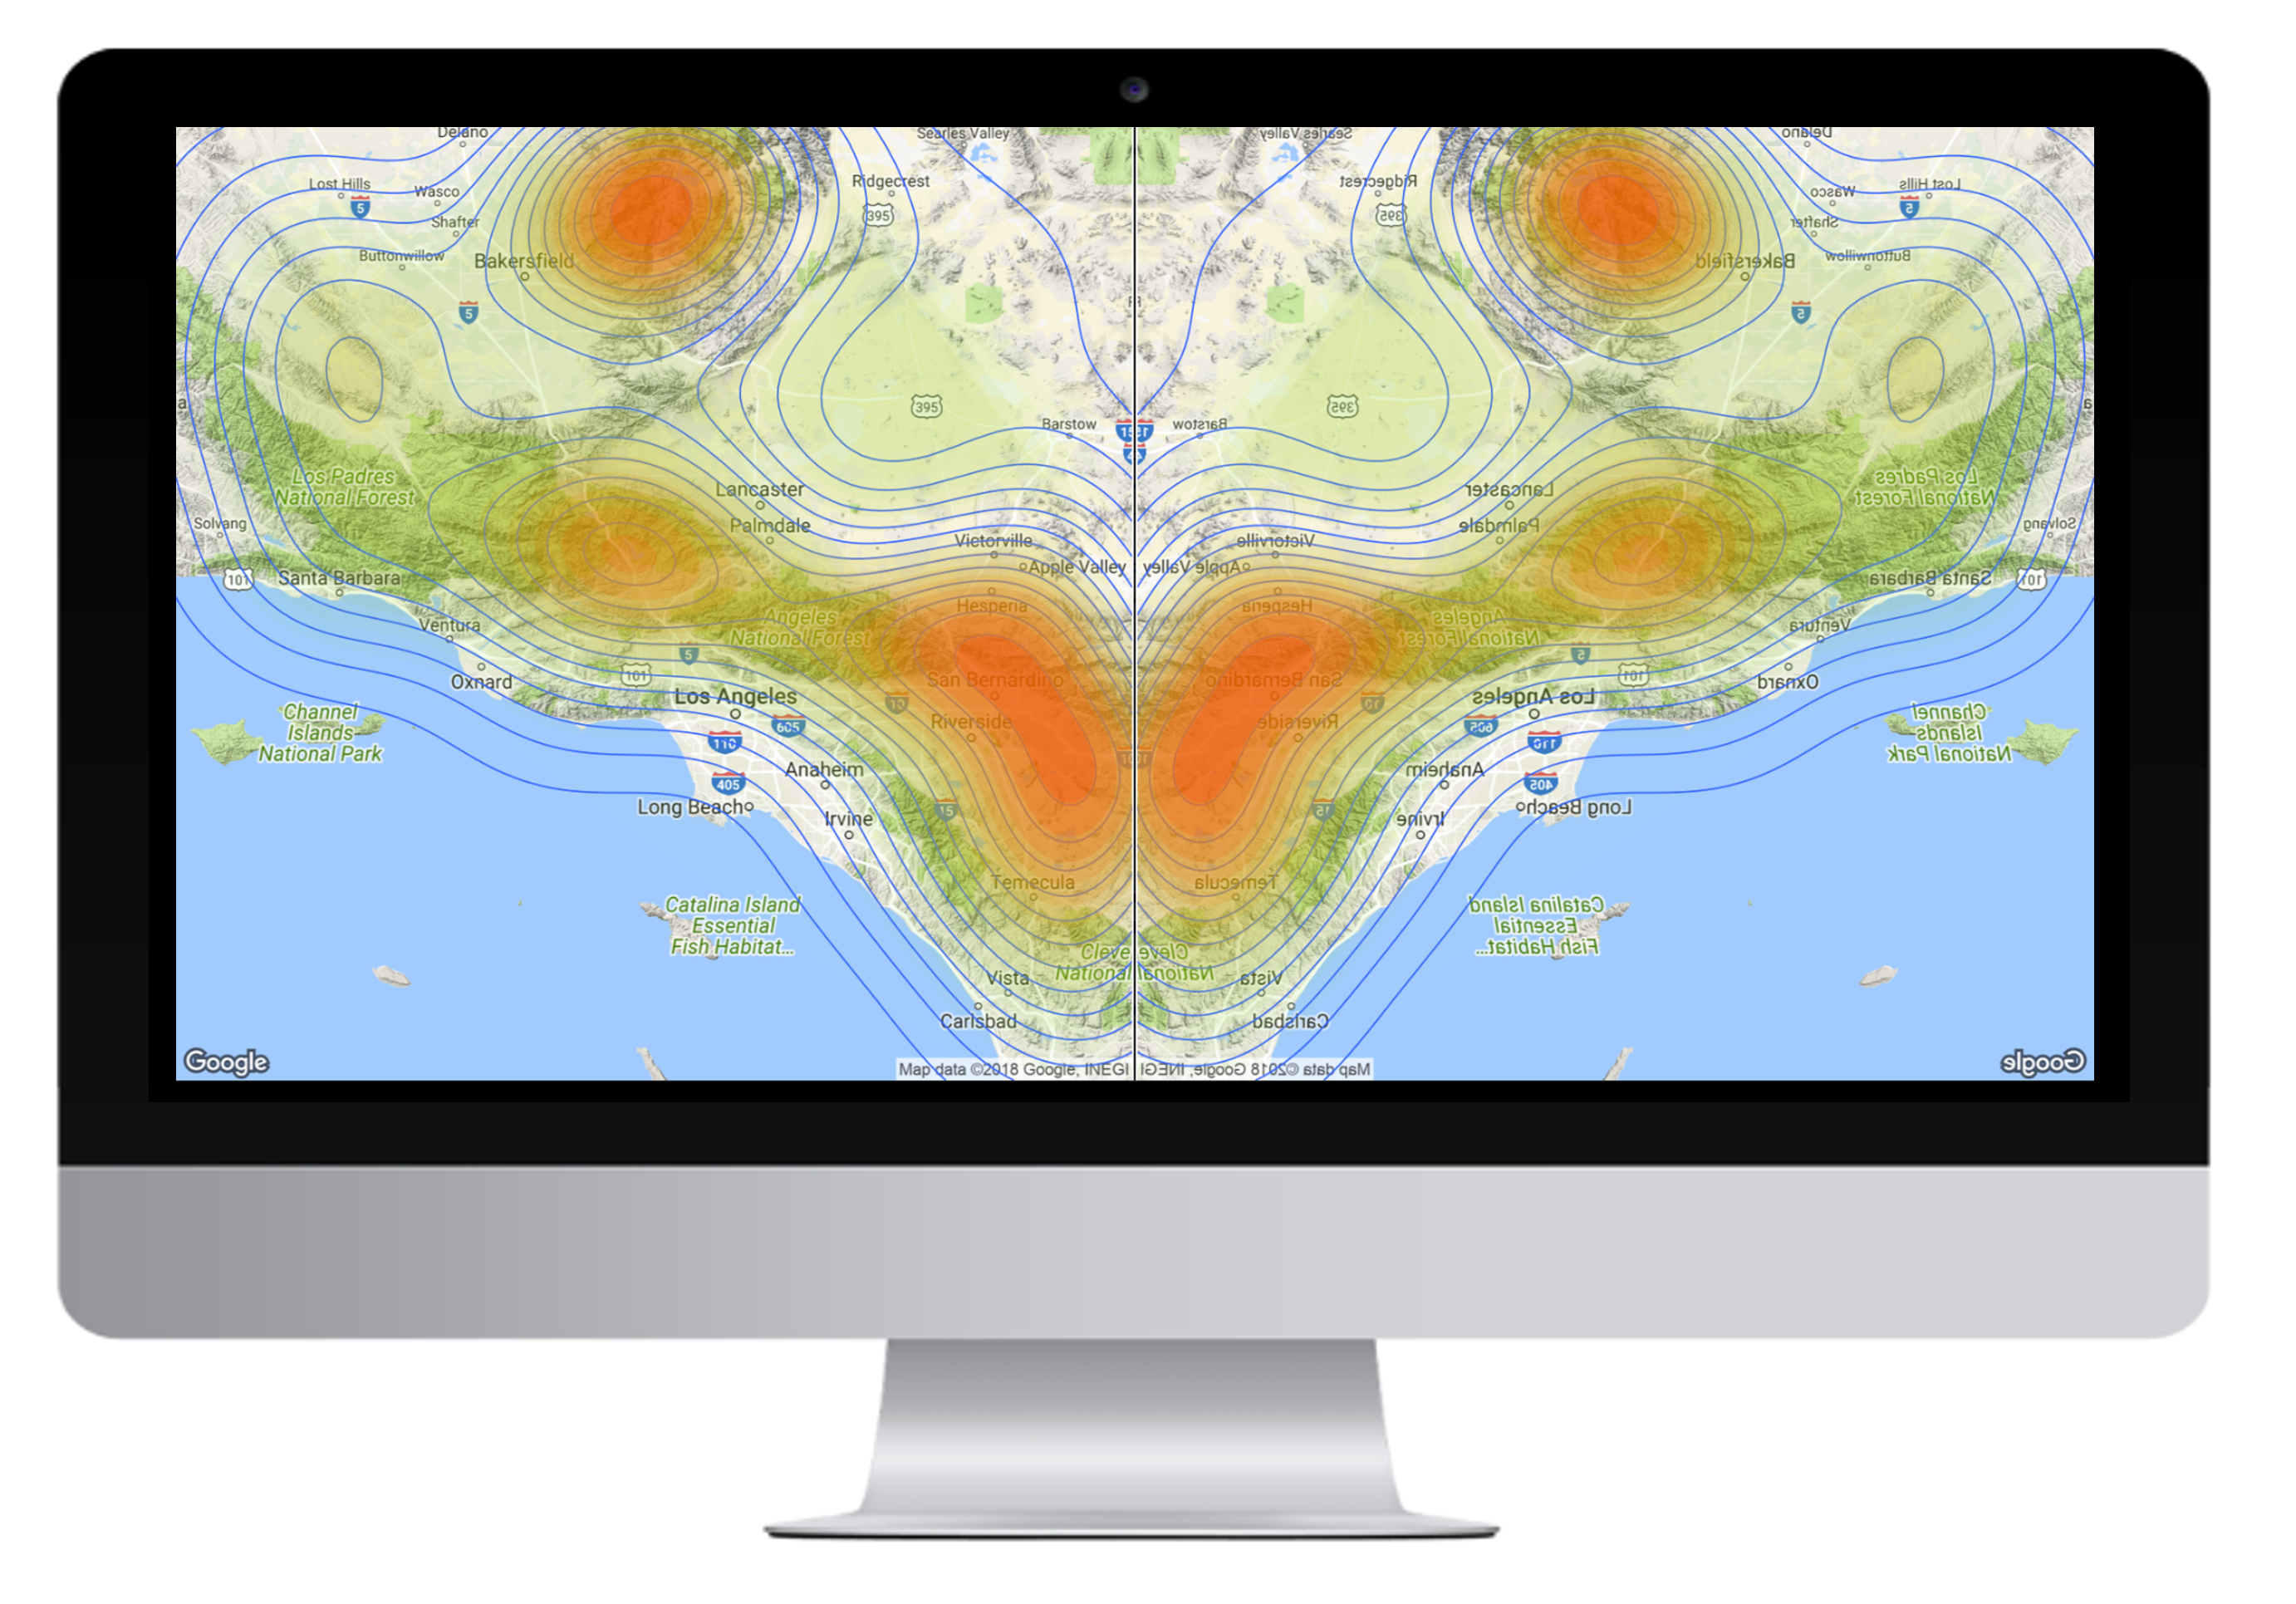

Spatial statistics extends traditional statistics through the analysis of geographic data via techniques that describe the distribution of data (descriptive spatial statistics), analysis of spatial patterns of data (spatial pattern analysis), identification and measurement of spatial relationships (spatial regression), and the creation of surface layers through sampled data (spatial interpolation).
We use spatial analysis and geostatistical tools from ArcGIS Pro (Spatial Statistics Toolbox, Spatial Analyst and Geostatistical Toolbox), R, Python, and others to perform analysis for natural resources, real estate, crime, health, and environmental applications.
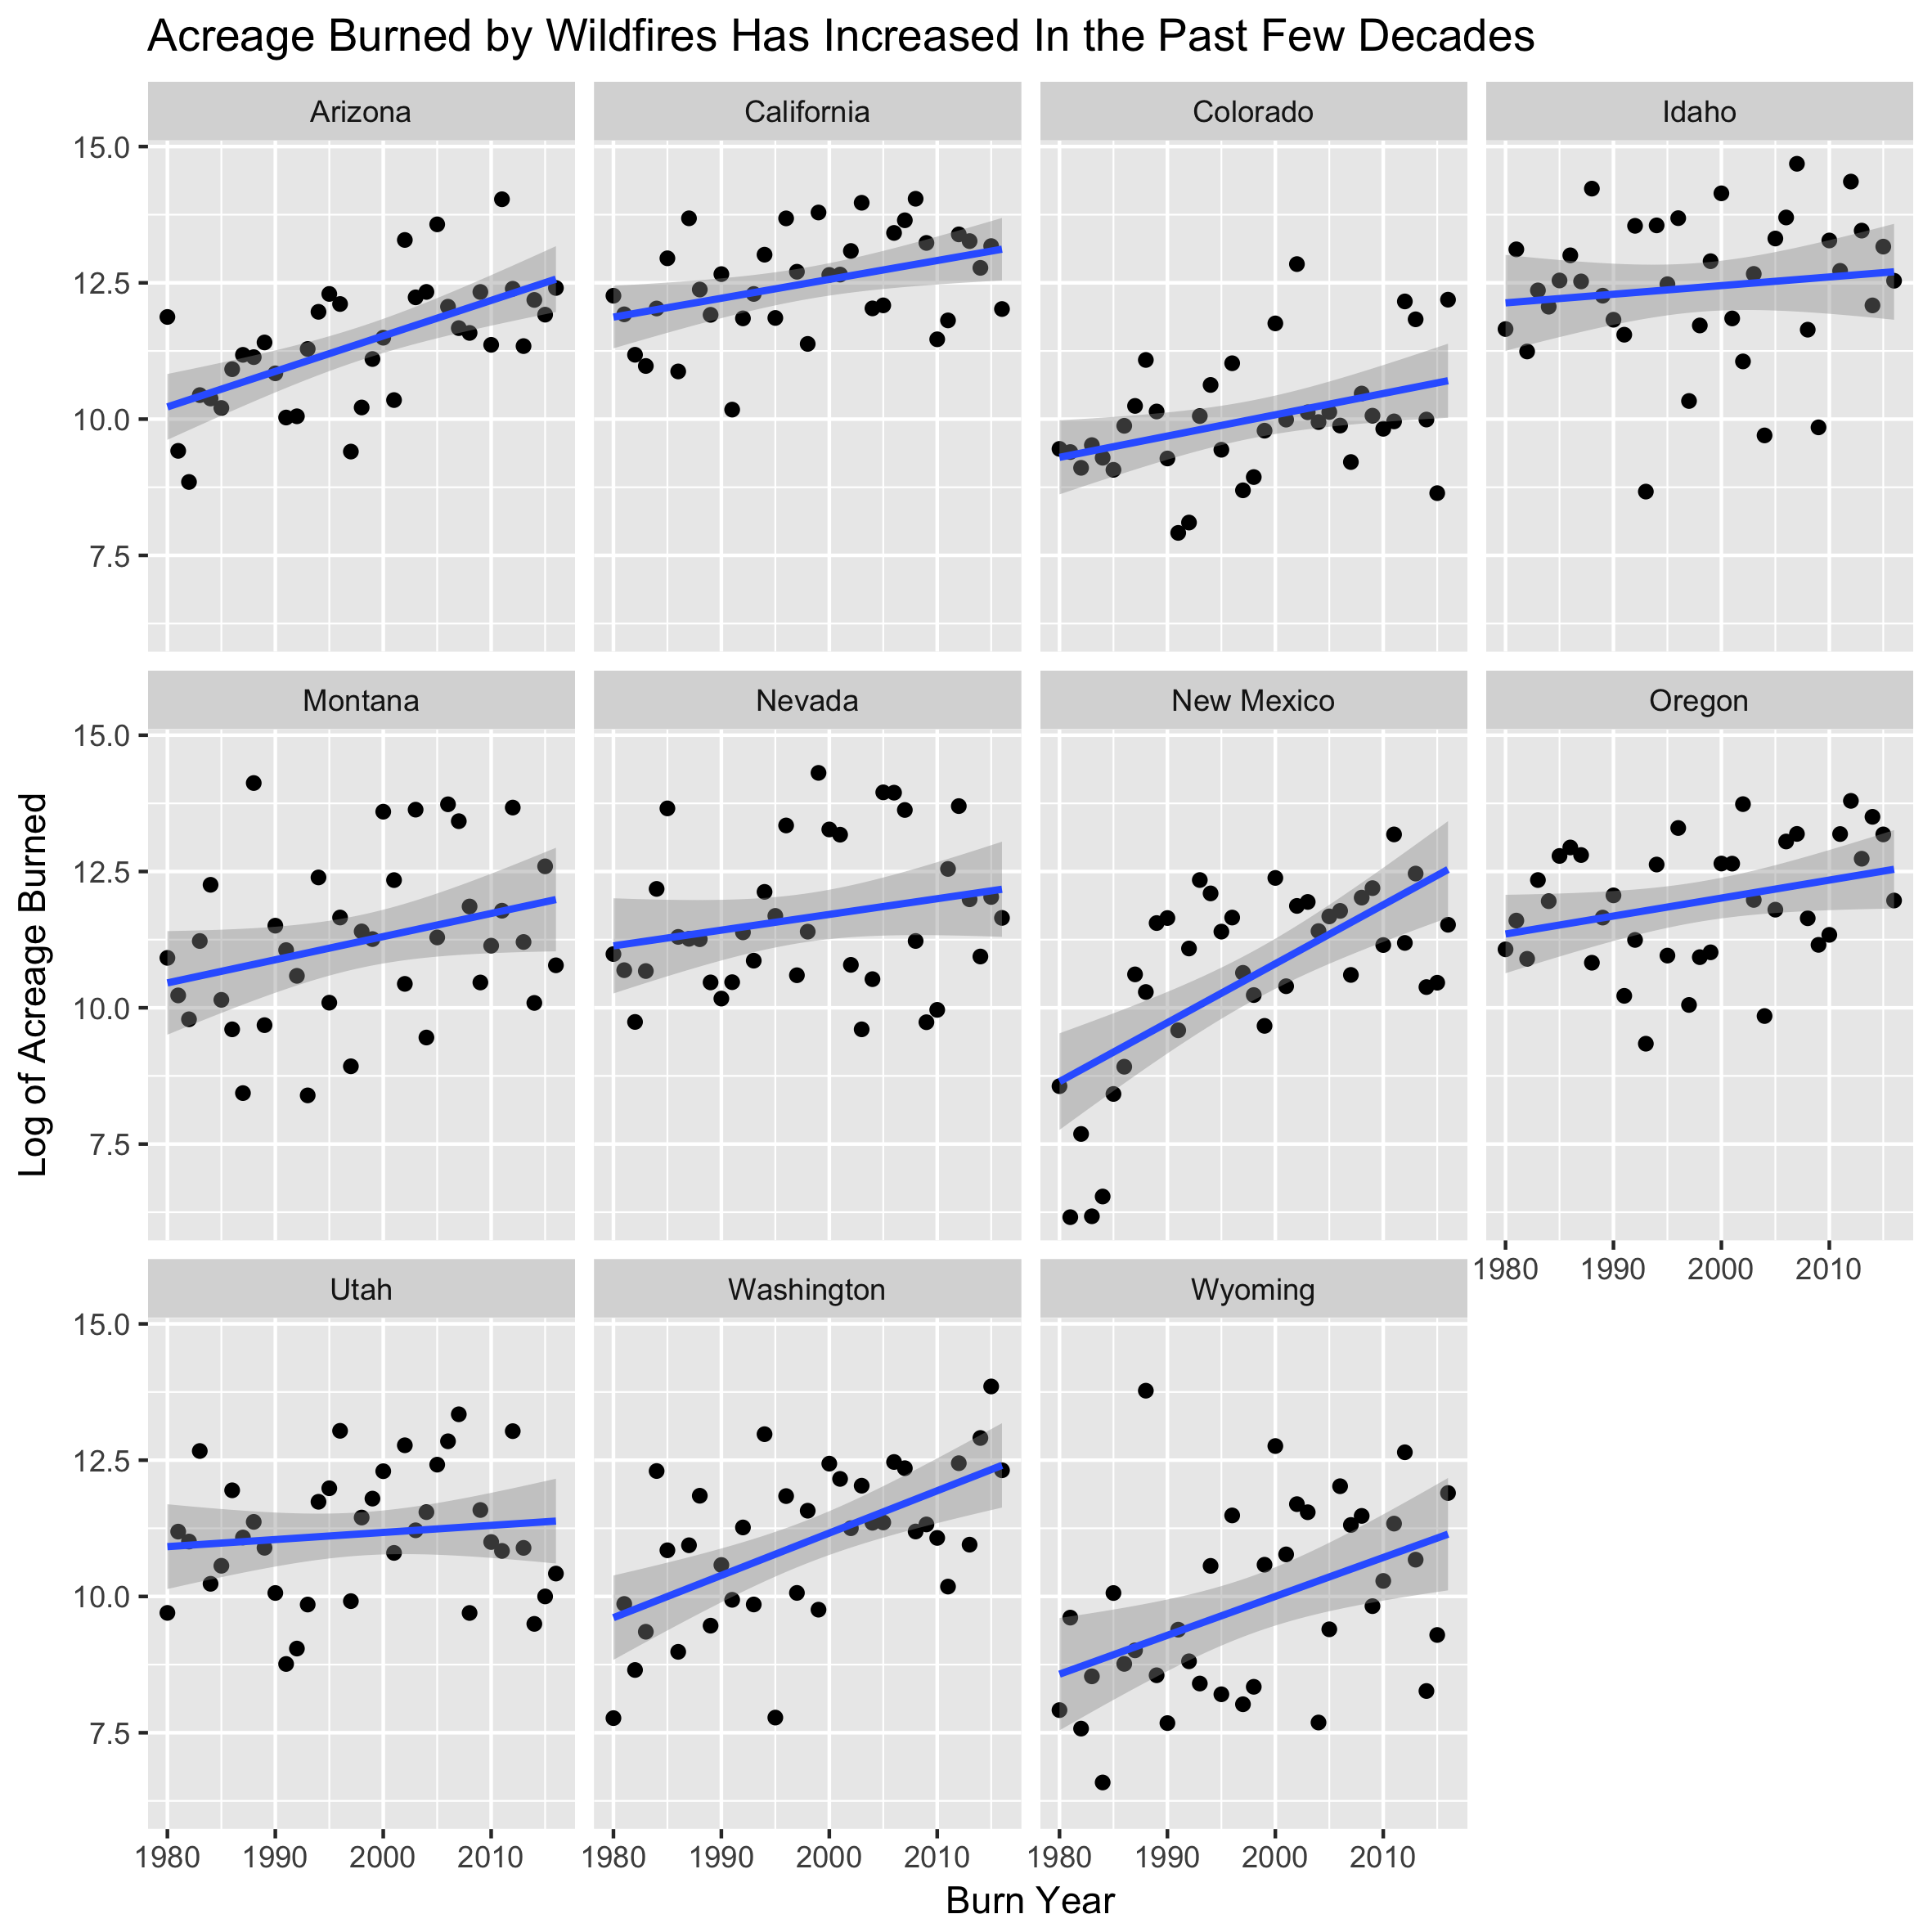
Historical Analysis of Wildfire Patterns
Using the Federal Wildland Fire Occurrence Database, we used ArcGIS Pro and the R programming language to better visualize the change in wildfire activity from 1980 to 2016. Our analysis was limited to the Western United States including California, Arizona, New Mexico, Colorado, Utah, Nevada, Utah, Oregon, Washington, Idaho, Montana, and Wyoming. We were particularly interested in the surge of large wildland fires, categorized as fires that burn greater than 1,000 acres.
What we found is a dramatic increase in the number and size of wildfires throughout the Western United States. We also found an increase in the length of fire season throughout the area as well.
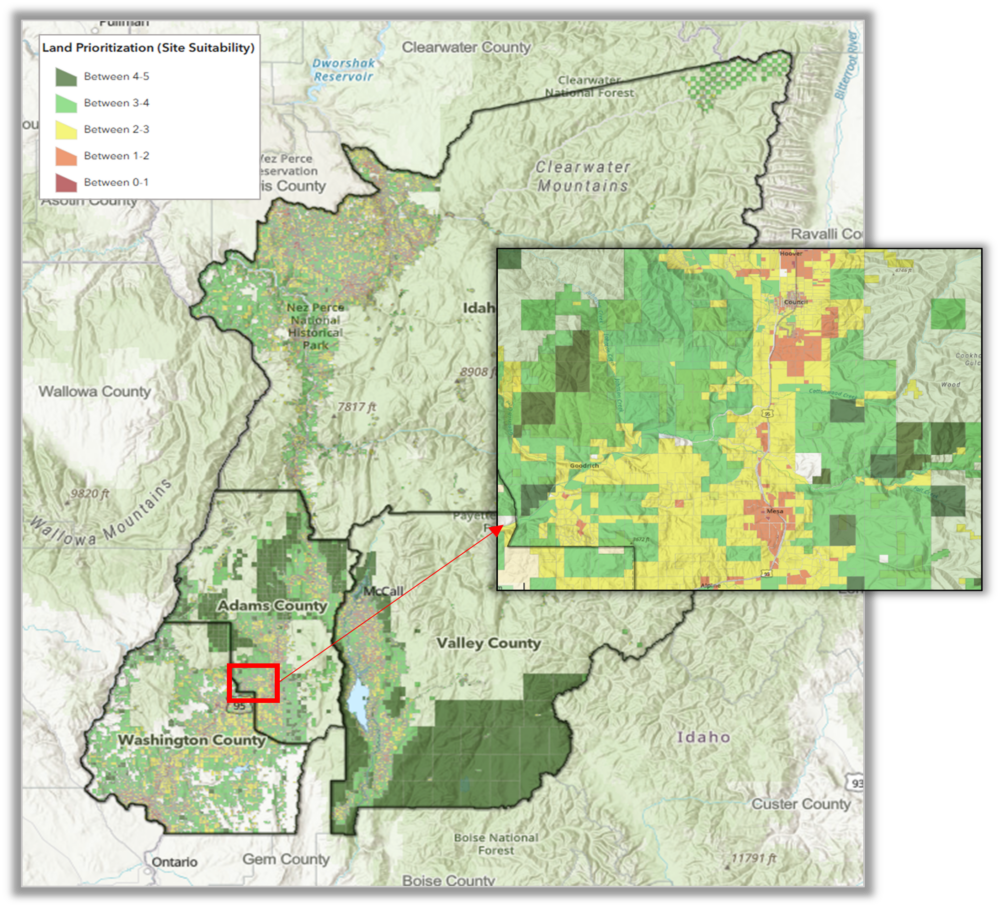
Land and Site Suitability Modeling
The Payette Land Trust Site Suitability Model was created to find the most preferred land areas for conservation based on specific criteria. The 5 criteria chosen by the Payette Land Trust are based on their mission and values as an agency: Agriculture, Timber, Water, Acreage, and Proximity to Protected Areas. The resulting Suitability Scores were calculated based on all 5 criteria. Higher Site Suitability Scores given to a property show a higher conservation priority for that property. This will help the PLT prioritize and focus their time and resources relative to conserving properties within their 4-county service area.
Automation with Python, ModelBuilder, and Tasks
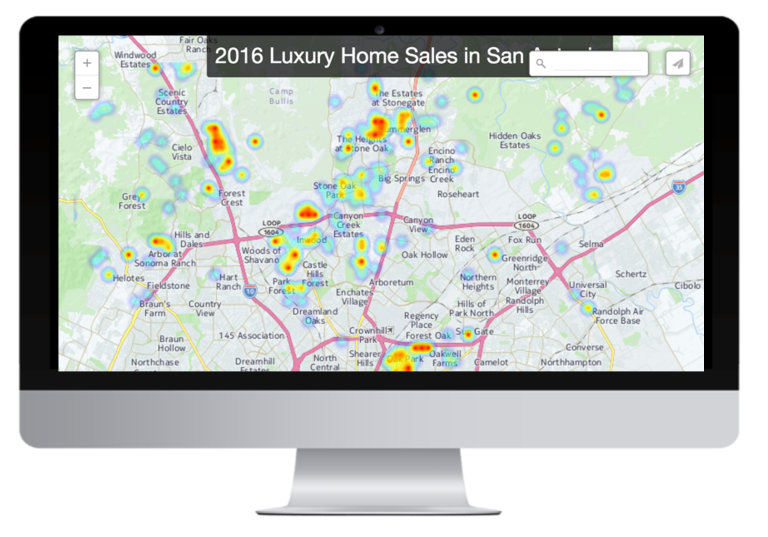
Analysis of Real Estate Activity in San Antonio
Geospatial Training Services implemented a geoprocessing workflow for a local real estate company that processes monthly residential home sales information on a monthly basis and creates over 2000 reports on individual neighborhoods in the San Antonio metropolitan area. Each report contains tables, graphs, charts, and interactive maps.
The workflow uses ArcGIS Desktop including the Spatial Statistics Toolbox, Python with ArcPy, Plotly, and Carto to create the reports. The entire process is automated with Python scripts that are scheduled to run at specific times of the month. Screenshots of the output products are provided below.
Contact Geospatial Training Services to schedule a time to discuss your geoprocessing automation and application development needs.
Technologies Used:
