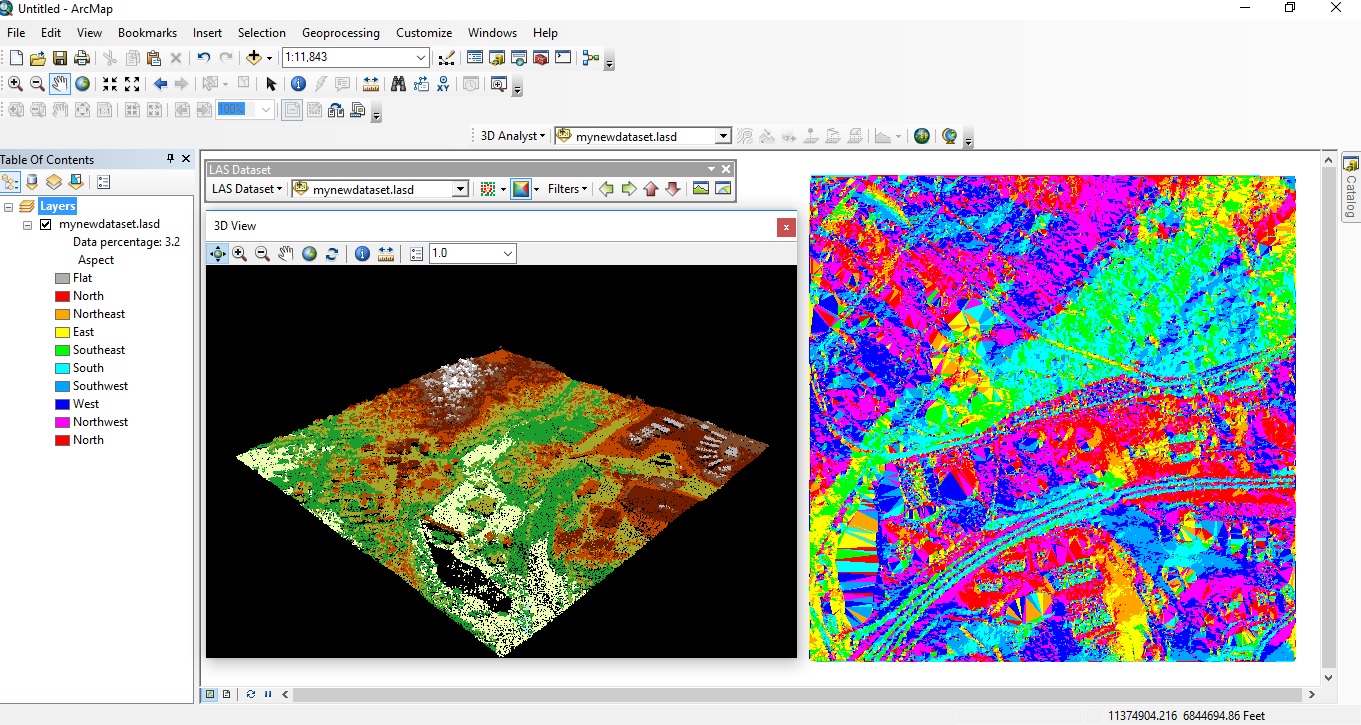
Since the release of version 10.1, ArcGIS Desktop offers native support for LAS files, the industry-standard binary file format for storing airborne LiDAR data. Introduced in version 10.2.2 of ArcGIS Desktop, the LAS Dataset file is a new file format for storing multiple LiDAR files in ArcGIS Desktop. 2D and 3D visualization tools are offered through the LAS Dataset Toolbar.
By Eric van Rees
What is LiDAR?
LiDAR is an optical remote sensing technique that uses laser light to densely sample the surface of the earth. A LiDAR system is used to build up a complex ‘map’ of the surface it is measuring, producing highly accurate x, y and z measurements that are stored in LAS files. LiDAR data can be defined as vector-based source measurement data, for which ArcGIS Desktop offers many different editing, visualization and analysis capabilities. LiDAR data can also be used in terrain (vector-based) and mosaic datasets (raster-based) within ArcGIS Desktop.
Because many tools in ArcMap were designed for handling airborne LiDAR, it is assumed you use this type of data in ArcMap rather than terrestrial LiDAR data, although ArcGIS Desktop supports both LiDAR types.
What are LAS Datasets?
A LAS Dataset is an Esri file format that can be used to store multiple LAS files as one logical dataset. After creating and naming such a (empty) file in ArcCatalog through a single right mouse click, you can manually add existing LAS files to the dataset. However, an LAS dataset does not import point data contained in LAS files; it stores reference to LAS files as well as surface constraints stored in shapefiles or feature classes. LAS datasets can be visualized in both 2D and 3D. This can be done in ArcMap as well as ArcScene, a separate viewer for 3D feature and raster data in ArcMap.
Displaying LAS datasets
The LAS dataset default display in ArcMap and in ArcScene is as a point cloud with no filter applied, which means that all the LiDAR points are displayed initially if zoomed to an extent where thinned points are displayed. ArcScene is the best option for viewing terrestrial LiDAR, that can be used as a backdrop for digitizing measurements and features. The user should be also aware that there are differences between the capabilities of both applications.
When a LAS dataset is added to the main map window in ArcMap, a layer is added to the table of contents, thereby providing access to standard layer functionality through the Layer Properties dialog box. The LAS file format specification, created by the American Society for Photogrammetry and Remote Sensing (ASPRS), classifies the collected laser points into different feature types, that can be reproduced and edited in ArcMap.
LAS Dataset Toolbar visualization options
Available with a 3D Analyst license, ArcMap and ArcScene offer an interactive LAS Dataset Toolbar where you can toggle between the points and TIN surface visualization when displaying LAS datasets. The toolbar also comes with various spatial symbology renderers for each visualization type. A TIN is a vector-based representation of the physical land surface or sea bottom, made up of irregularly distributed nodes and lines with three-dimensional coordinates (x, y, and z) that are arranged in a network of non-overlapping triangles.
The LAS Dataset toolbar can be enabled through the “Customize -> Toolbars” tab in the main screen of ArcMap. On the far right of the toolbar in ArcMap is a 3D View option button, that opens a new window and displays the LAS dataset in 3D. It is coupled to the data in the 2D main window, so every time you update the data there, refreshing the 3D window results in a new 3D view as well. The LAS Dataset Toolbar in ArcMap also has a 2D Profile Viewer, for selecting and editing a selected set of points from a LAS dataset. It can also be used to measure distances and heights between points and manually edit and update LAS classification codes.

