This is a short tutorial where we use ArcGIS Notebooks inside ArcGIS Pro to do data exploration and analysis.
In this tutorial you’ll learn the following:
- How to create a new Notebook inside an ArcGIS Pro project
- How to reference a local workspace using arcpy
- How to create a pandas dataframe of a feature class using the arcgis and pandas packages
- How to perform quick data inspection using pandas
- How to perform a SQL query with a “group by” clause using pandas for data analysis
STEP ONE: Creating a new project and loading a data layer
Open up ArcGIS Pro and create a new, empty project. This particular project is called “Notebook”. Before we load a data layer, click the “Project” tab and choose “Options”. A new window opens with on the left a list of settings under Project. The first setting is called “Current Settings” and contains five fields that contain information about your current project, such as the name of the project and the location on disk. The information under “home folder” is used below, but now you know where to find this information when referencing file folders on disk when using arcpy.
Next, click “Cancel” or “OK” and click the arrow button that points to the left in the upper-left part of the screen to return to the map interface. We’ll use a point layer with all hospitals in England for this tutorial, that is available through ArcGIS Online. If you have Portal extension, select Portal through the Catalog window and click on the ArcGIS Online icon (representing a cloud). Search for a hosted feature layer called “Hospitals England” and add it to the map. You might not be able to see the data as it’s only visible when zoomed in. Here’s how the data should look like:
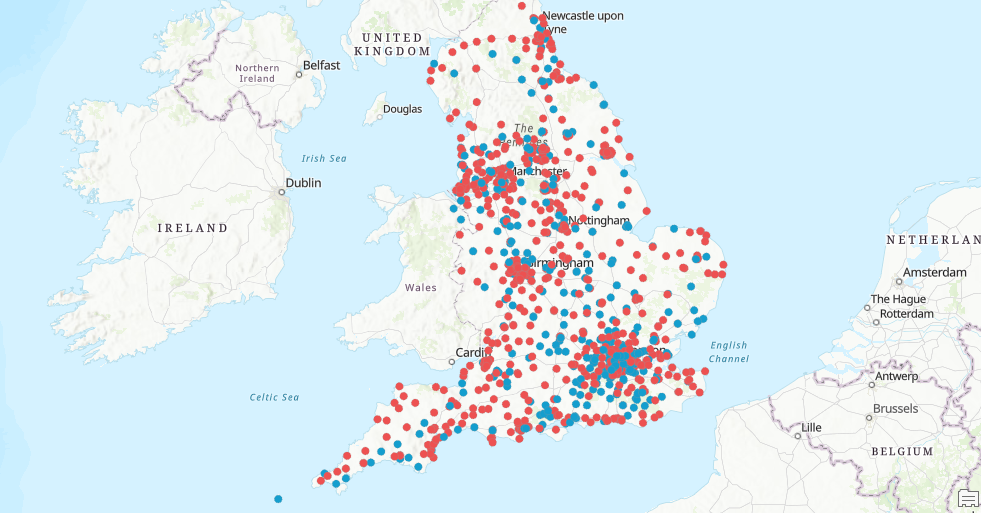
The data represents all hospitals in England, divided into two categories: red for NHS sector hospitals and blue for Independent Sector hospitals. We’ll now use Python to get an idea of the geographic distribution of hospitals per county to see which county has the most hospitals and which type (blue or red).
STEP 2: Create a new notebook
We will now create a notebook inside ArcGIS Pro to start writing code. There are multiple ways to create a new notebook: the quickest way through the ribbon interface by selecting the “Insert” menu and clicking “New Notebook”. You can also use the Catalog window by selecting the “Project” tab and right-clicking the “Notebook” icon and select “New Notebook”. A new notebook will be created next. If you want to see both the map interface and the notebook, it’s best to dock the notebook to the left part of the screen by selecting the notebook with your mouse, move it around so it starts floating and a cross will appear that lets you select a direction for docking the notebook. We’ll now start writing code.
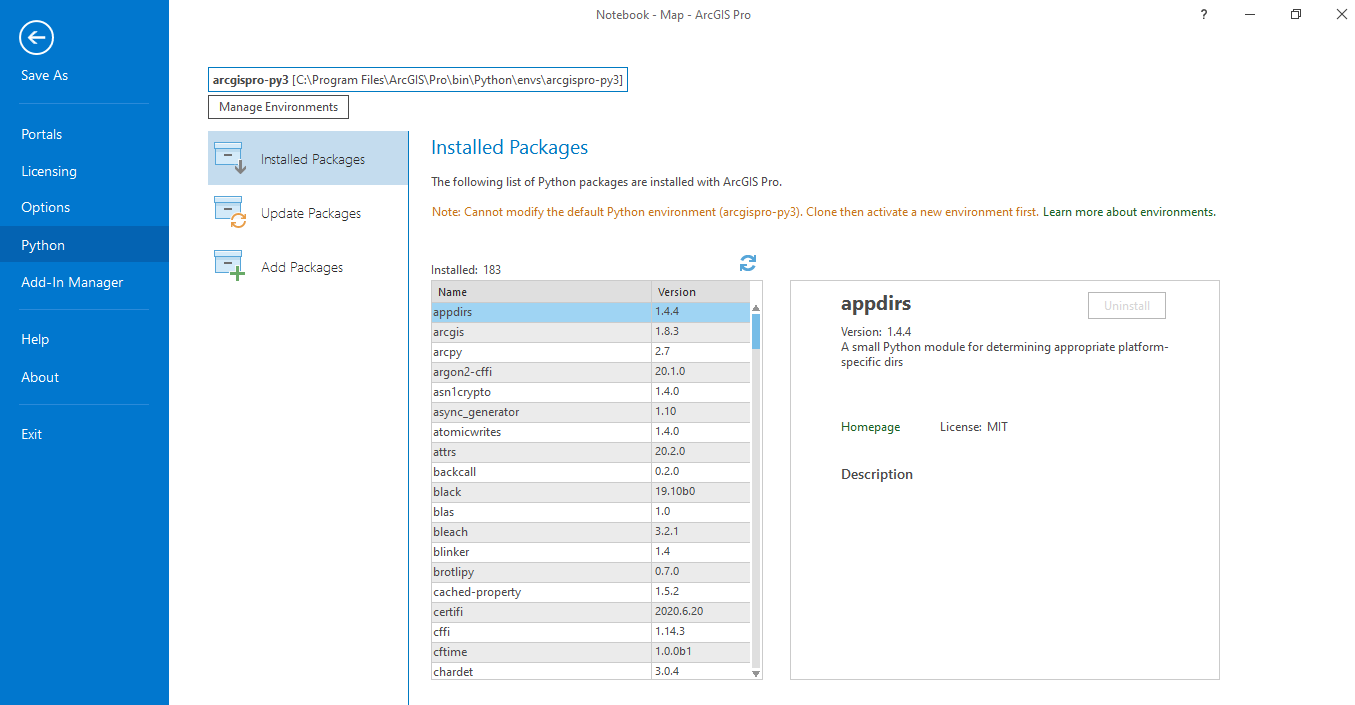
STEP 3: Write the Python code We’ll start by importing the required python packages. These are arcpy, arcgis and pandas. All these packages come with a standard installation of Pro. You can check which packages are available for your project by heading over to the “Project” button and select “Python”, where you can see the installed packages under “Installed Packages”:
In the notebook, use the following code for the first cell and run it:
import arcpy
from arcgis.gis import GIS
import pandas as pd
We need the arcpy module to reference the file on disk, the arcgis module for convert an attribute table to a pandas DataFrame and pandas to query the data.
Next, reference the current workspace with the following code in a new notebook cell and run it using the “Run” button at the top of the notebook or using “SHIFT” + “ENTER”:
arcpy.env.workspace = r”C:\Users\[username]\Documents\ArcGIS\Projects\Notebook”
Here, we reference the workspace on disk. The [username] is a placeholder for your own username. Next, create a pandas DataFrame object by using the “from_featureclass” method from the arcgis.spatial module stacked onto the pandas method for creating a DataFrame as follows, with the hospital point layer as an argument:
df = pd.DataFrame.spatial.from_featureclass(“Hospitals_England”)
Print the first five entries in the notebook with the following command in a new notebook cell:
df.head()
This visualization is similar to opening an attribute table, but it is now available as a copy and as a pandas dataframe which is a handy format for data inspection and analysis. A pandas dataframe is a numpy array. Before the existence of the arcgis module, it was possible to convert an attribute table to a numpy array using arcpy, but this is much easier using the from_featureclass method used above.
Use the following command to get a list of all column values:
df.columns.values
We’ll use the “Sector” and “County” values next to see which county has the highest number of values and group the different hospital types per county.
Use the following code to count the hospitals per county and see the four counties with the highest counts:
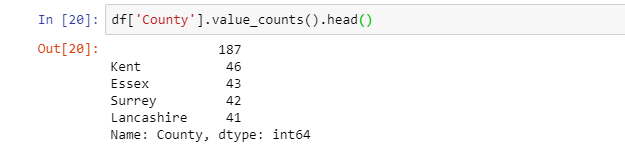
df[‘County’].value_counts().head()
The default order in which pandas displays the count values is descending. We see that Kent has the most hospitals, followed by Essex, Sussex and Lancashire:
We’ll now use the “Sector” column to see how many hospitals there for each type, using the following code:
df[‘Sector’].value_counts().head()
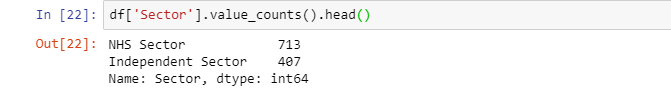
This tells us there are NHS Sector hospitals than Independent Sector hospitals, 306 to exact. Note that the total count is significantly higher than the 187 hospitals found when counting them using the County column, which probably means missing values there.
To create subgroups of hospital (namely belonging to a blue or red category) per county, we can use the following code. This would be the same as using a SQL query using a Group By clause:
n_by_county = df.groupby([“County”, “Sector”])[“County”].count()
This statement does not print any output, so we have to use a python print statement to see the results:
print(n_by_county)
The output is listed alphabetically using the county names, but shows only a selection of the total output. To have Python print all values in one code cell, use this code:
pd.set_option(‘display.max_rows’, None)
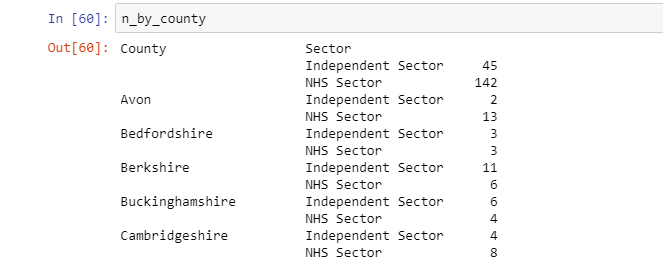
Now repeat the variable used for the output above to see the value counts per hospital type and country:
n_by_county
Here’s a snippet of the output: