

Learn more about our Experience Builder courses and upcoming training schedule.
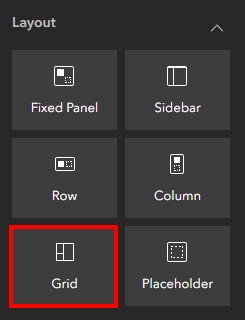
In all our years building applications with Experience Builder, we have found that the Layout widget options have been lacking. Aside from the Sidebar widget, which is a fantastic addition to any application layout, there just hasn’t been anything exciting. Until now! Recently, ESRI added a widget called “Grid” to the layout options and we just can’t get enough of it. The power of this widget to provide awesome and organized layouts with tabbed groupings and evenly spaced panels has our tails wagging with excitement! Ok, maybe that’s taking these metaphors a little far, but there is some truth behind that sentiment.
In this tutorial, you will learn how to use the Grid template to create awesome looking, easy-to-use layouts without having to spend hours constructing complex configurations. It’s as easy as drag, drop, and repeat.
What is the Blank Grid Template?
The Blank Grid Template is a template that was created using the same foundational elements as the Grid layout widget. When you create an application with this template, your page options are dominated with options relating to a Grid. This is something you cannot change, so anything you drag into your working canvas will be within grid panels and not outside of them.
STEP 1: First, find the Blank Grid Template, and click on the “Create” button in the lower left of the thumbnail.
![]()
Working with the Blank Grid template page settings
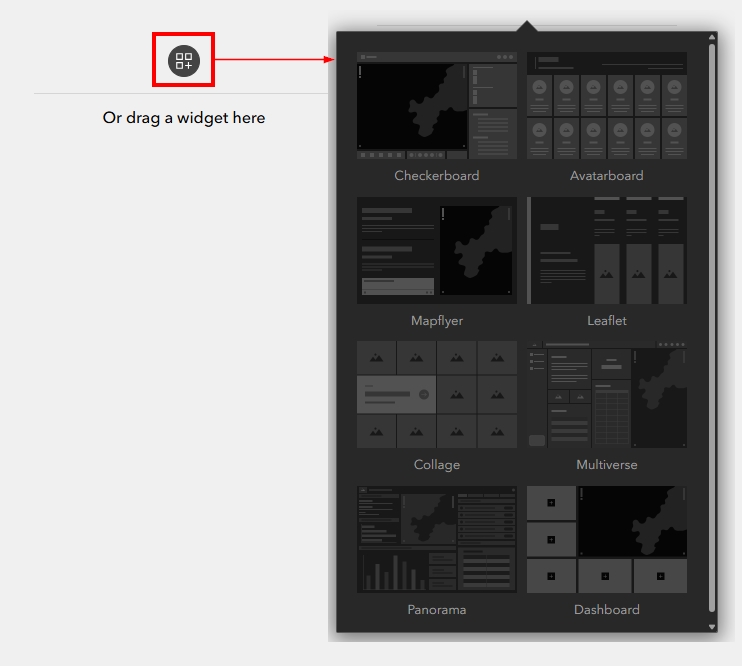
When the builder opens, you will see a blank canvas. To start working with this template, you can either drag a widget onto the blank canvas or to click on the small button and choose an already curated Grid layout from the gallery. If you view the below image, you will see the gallery of Grid-based Templates you can start with. These templates are also found in the primary Template Gallery when you first start to create an application. For the purposes of this tutorial, we are going to construct the layout ourselves instead of starting from a Grid-based Template.
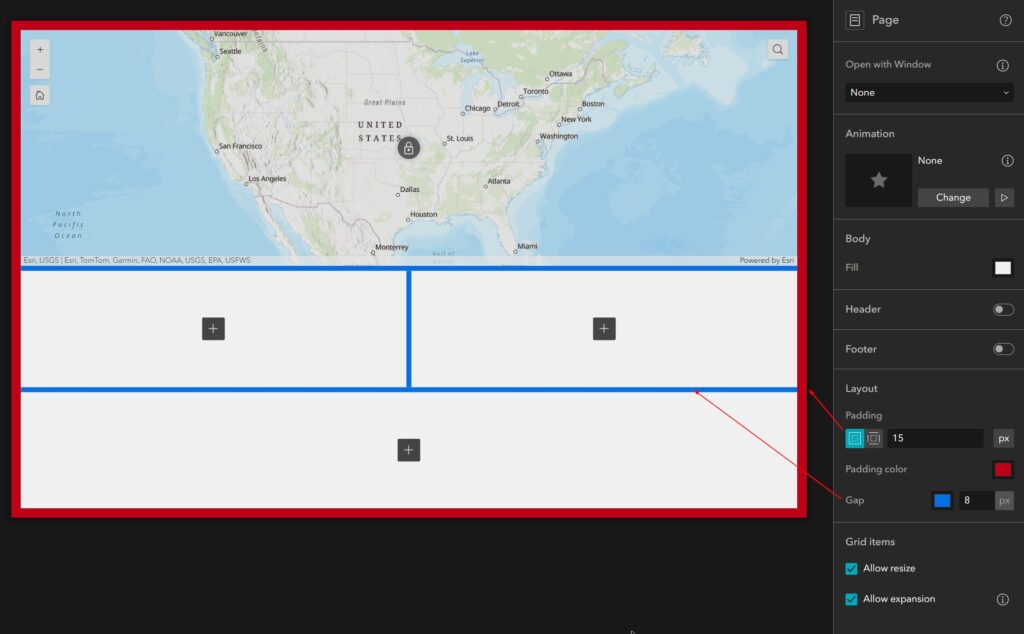
The Grid Template has page settings that are not found in most of the other templates. Toward the bottom of the settings panel on the right, you will see the configuration options that are specific to this Grid template which are titled “Layout” and “Grid Items”. Under “Layout”, there are options to customize the Padding and Gaps. The Padding is what frames the entire grid, whereas the Gaps are the lines that divide the grid panels. In the below image, you can see the red padding around the outer edges and the blue gaps between the grid panels.
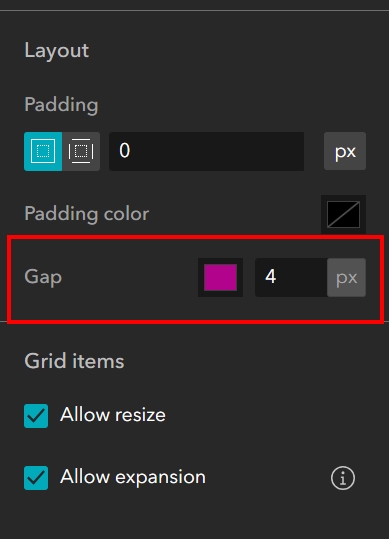
STEP 2: Find the page settings on the right. We will leave the Grid Items at the bottom as they are by default, and will not alter the padding, but we want to specify the gap color and thickness. Change the Gap color to something bright that will stand out, such as pink or teal, and then change the size to 4 pixels. Your Layout and Grid Item settings should resemble the below image.
Configuring a Grid layout
What we want to have as our end result is an application that gives our user the option to explore data through a map or a table, and then we want to provide 3 additional panels for the Legend, Chart, and Query widgets. We won’t be configuring the chart and query widgets for this tutorial, but we will pull them into the grid as placeholders.
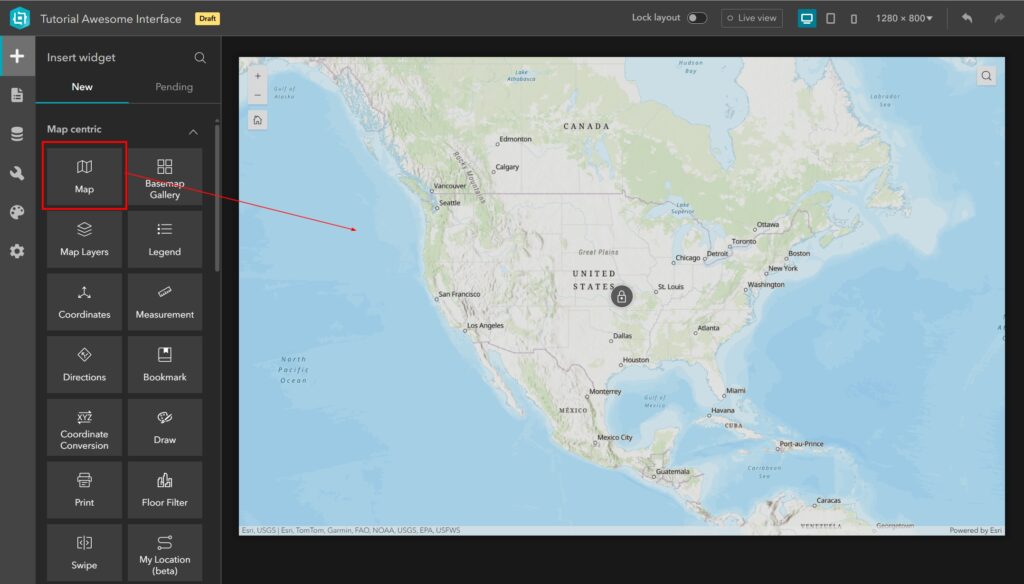
STEP 3: Pull the map widget onto the canvas and drop it anywhere. You will see the map frame fill the entire working canvas area.
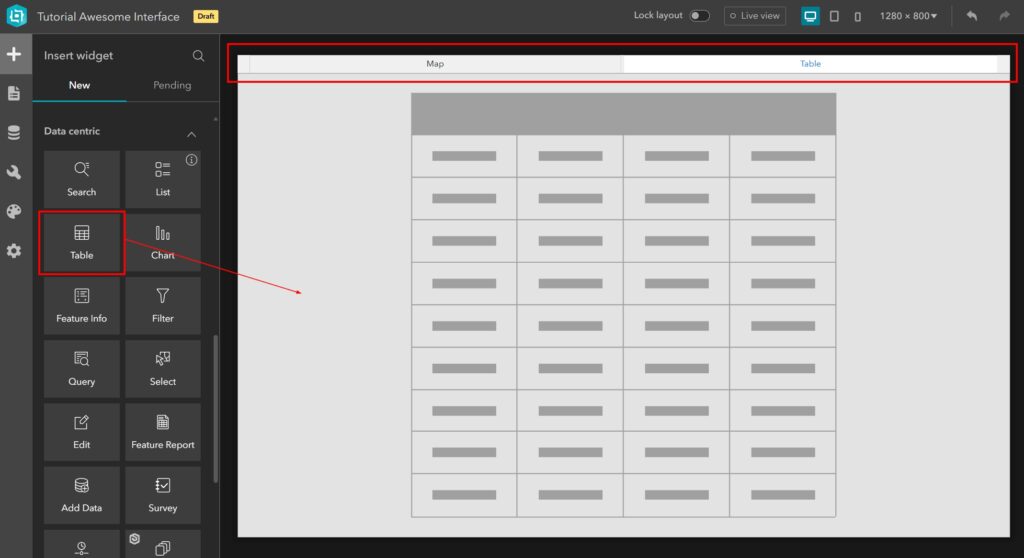
STEP 4: Pull the table widget on top of the map widget. You will see the Grid structure automatically create a grouped, tabular set-up where the user can click back and forth between the table and the map.
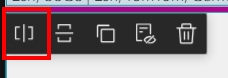
STEP 5: Click back over to the map tab and then click on the map, itself, to select it. Once you do, you will see a small on-canvas menu appear in the upper-left corner of the map area, as shown in the image below.

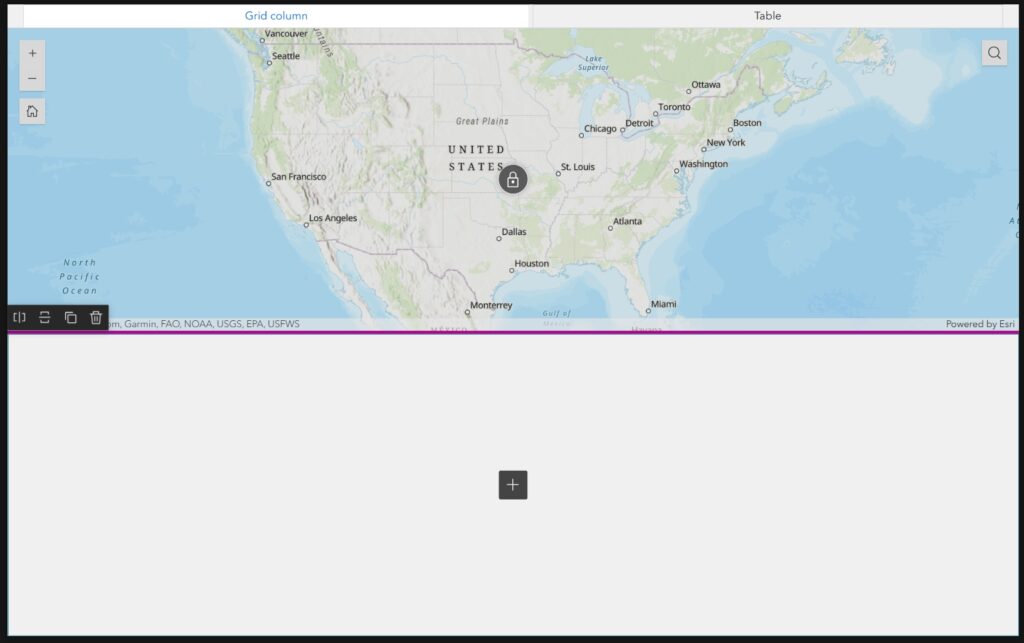
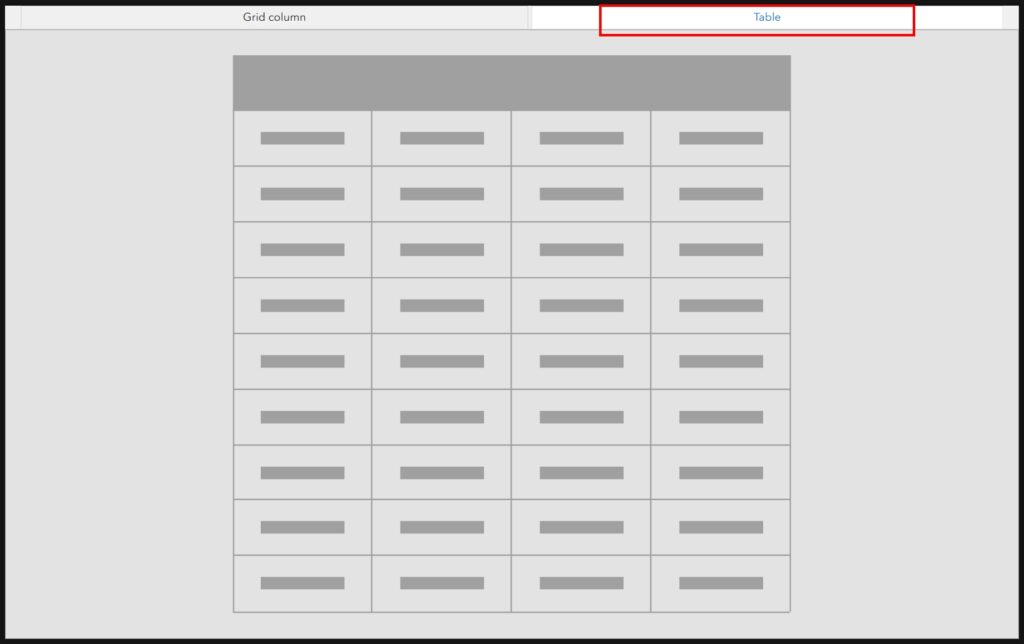
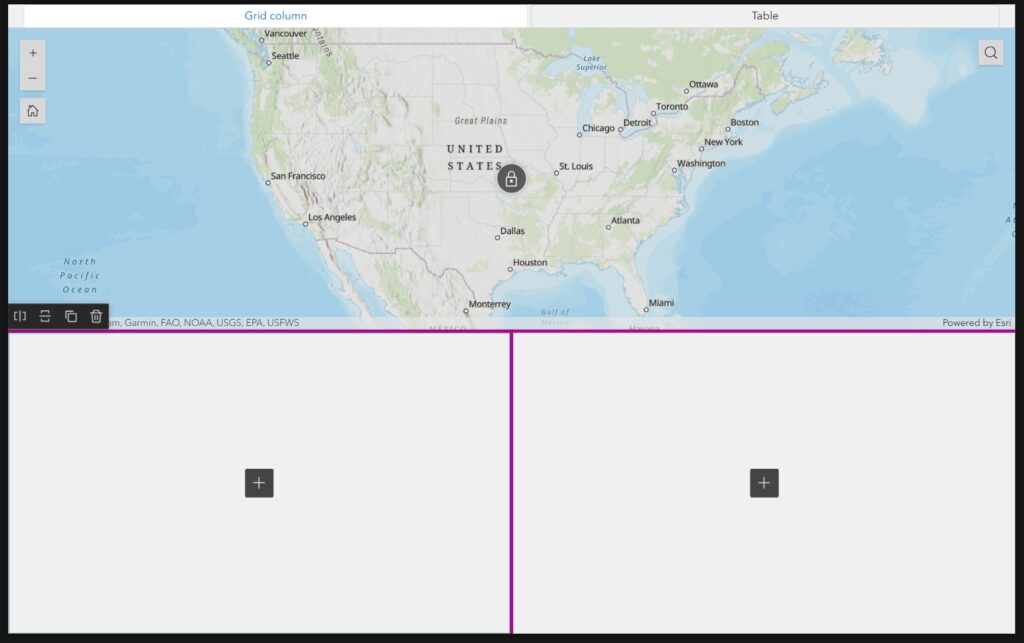
STEP 6: Click on the “Split Vertically” icon which is the second option from the left. This will split the page into two equal, vertically aligned sections as shown in the image below. Also notice that the name of the Map tab has changed to “Grid Column”. This is because the Grid column we just created only exists on the map tab, while the tab that holds the table only has a table. Click over to the Table tab to view the table before completing the next step.
![]()
STEP 7: Make sure you are on the Grid column tab and select the blank panel on the bottom of the canvas. Click on the “Split Horizontally” option. You will see the bottom now consists of two equally sized panels.
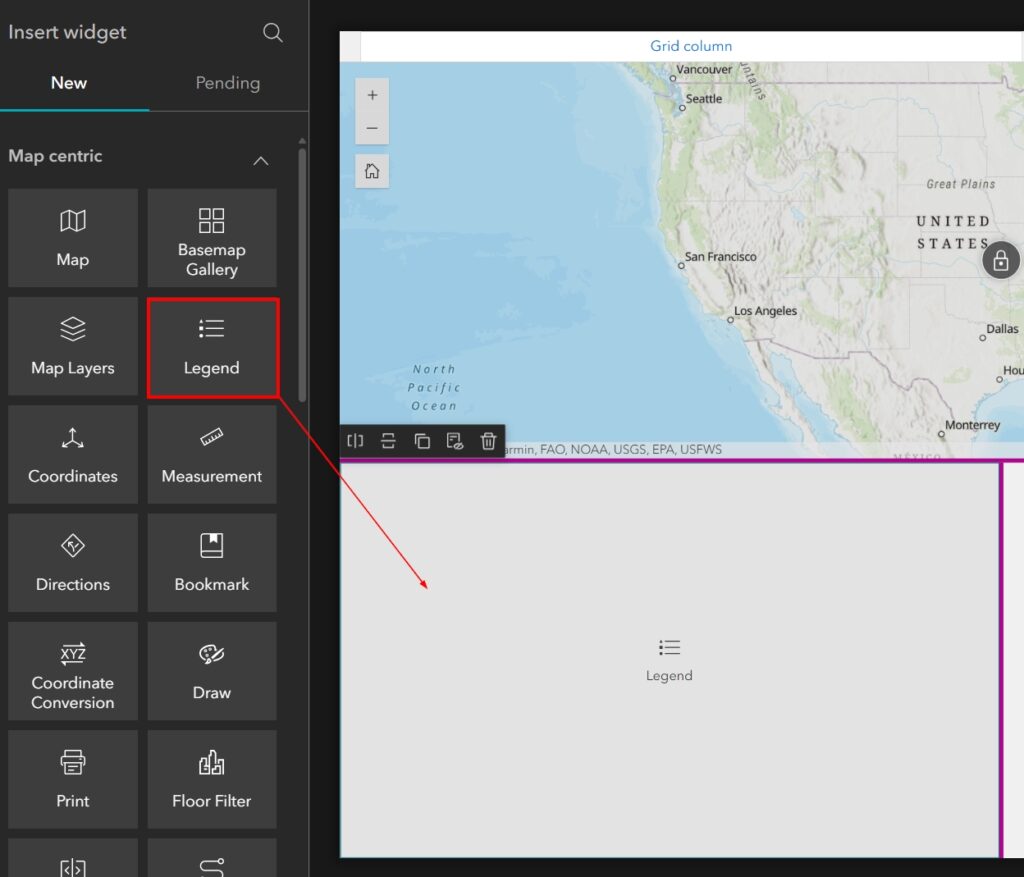
STEP 8: Drag the Legend widget into the panel on the lower left.
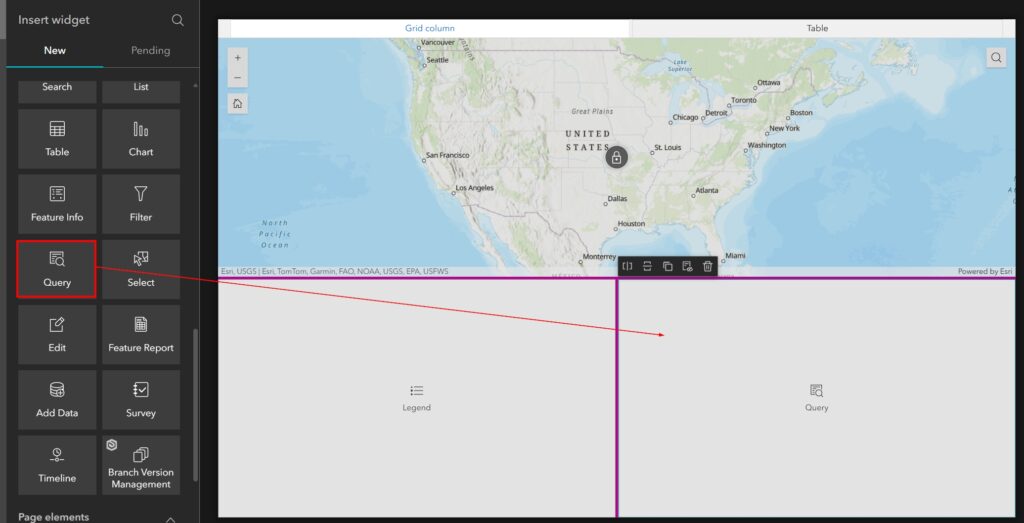
STEP 9: Drag the Query widget into the panel on the lower right.
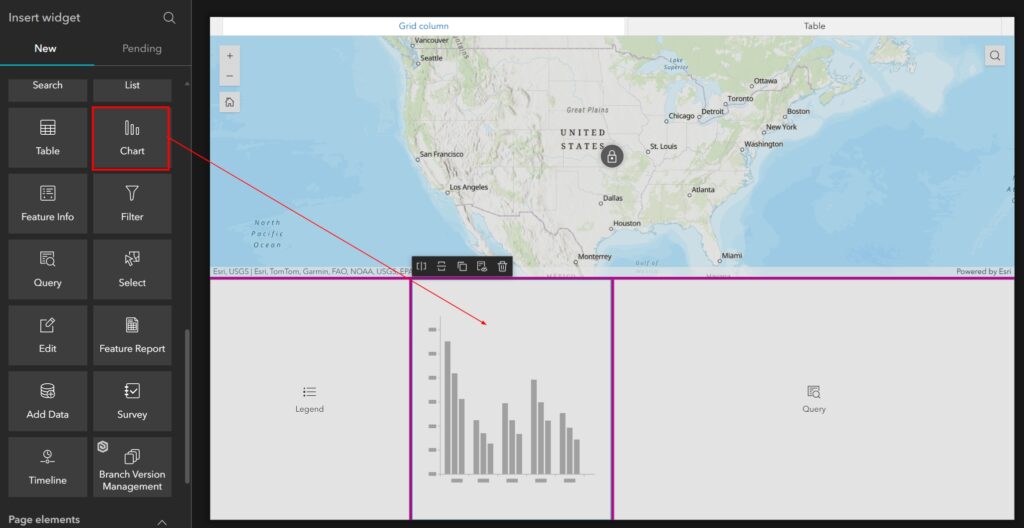
STEP 10: Drag the Chart widget into the right side of the Legend Panel.
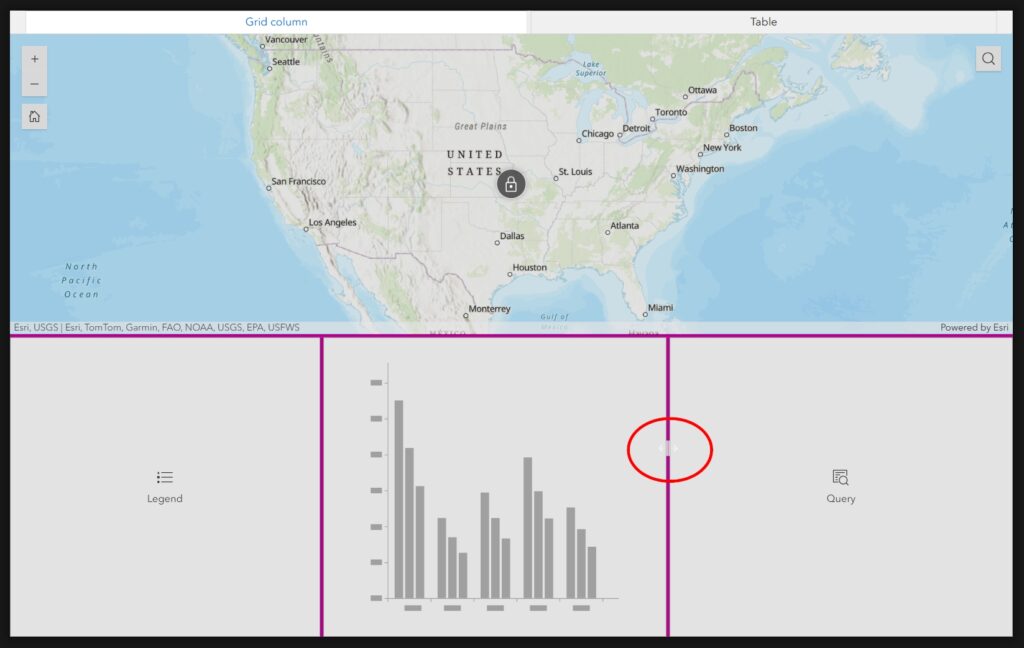
STEP 11: Hover your mouse over the Gap lines that exist between the Legend, Chart, and Query to resize the panels evenly. Your finished layout should resemble the below image.
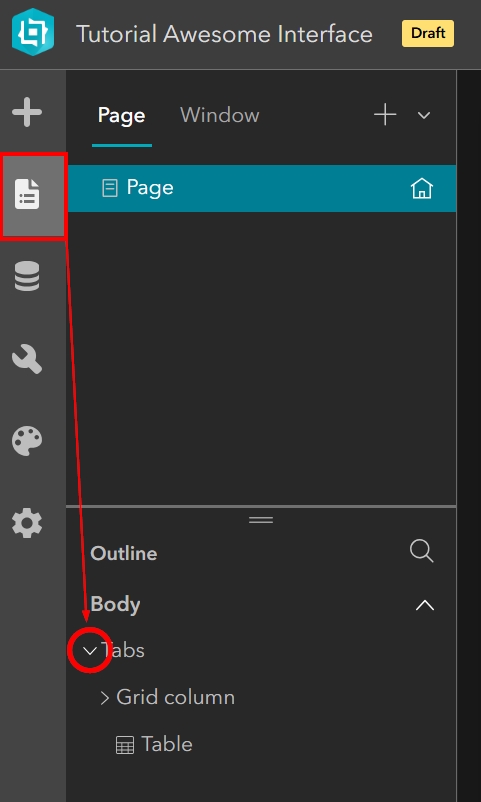
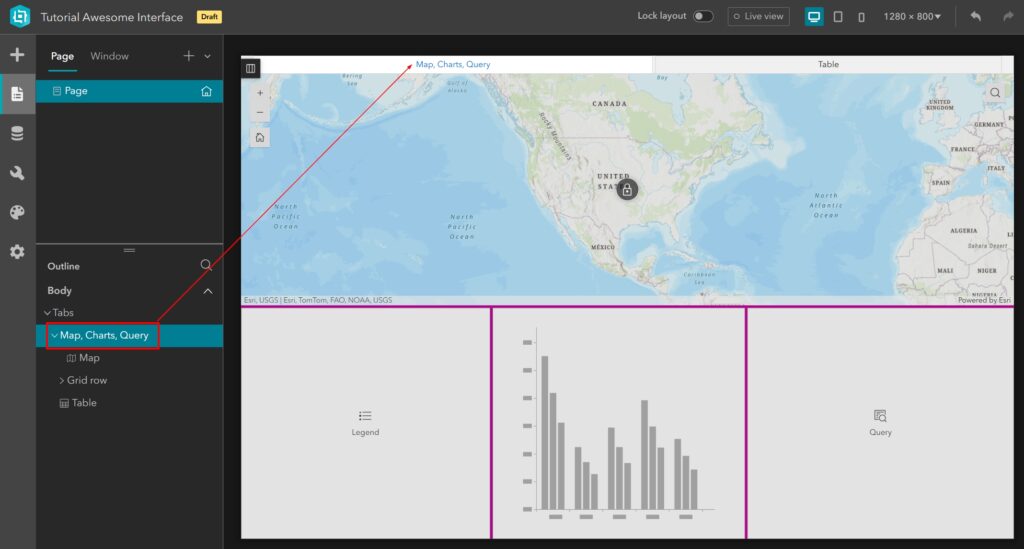
STEP 12: In these last steps, we are going to change the name of the Grid Column tab to something more meaningful. Click the Page button from the far-left menu to view the Page outline. Expand the “Tabs” section if you don’t already see the “Grid column”. See below image.
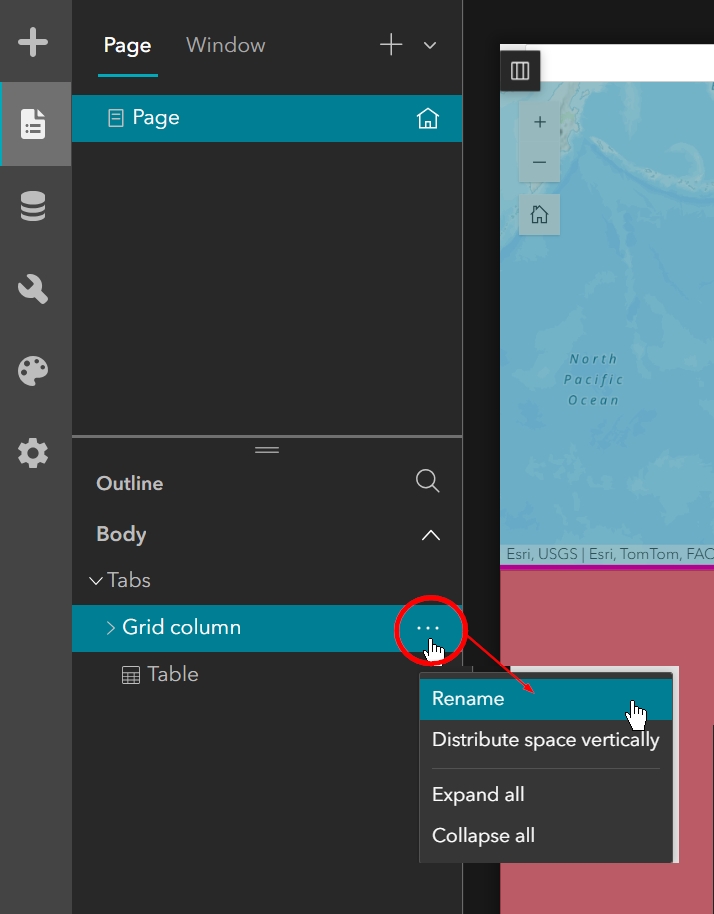
STEP 13: Click onto “Grid column” in the page outline to select it. When it is selected and you hover your mouse over it, you will see the overflow menu appear on the right as three dots. Click on these three dots and select “Rename” from the menu that appears.
STEP 14: Change the name to something meaningful, such as “Map, Charts, Query”. You will see the name of the tab change in your working canvas. Your final builder should look like the below image.
Summary
To summarize, we really enjoy creating applications with the Blank Grid template because of how easily we can group and tab different panels and how nice and clean the finished interface looks each time. The quick and painless process to create the Map and Table tabs described above is one of our favorite benefits of this template.
We hope you enjoyed this tutorial. For more tutorials, browse our Articles gallery and our YouTube channel.
