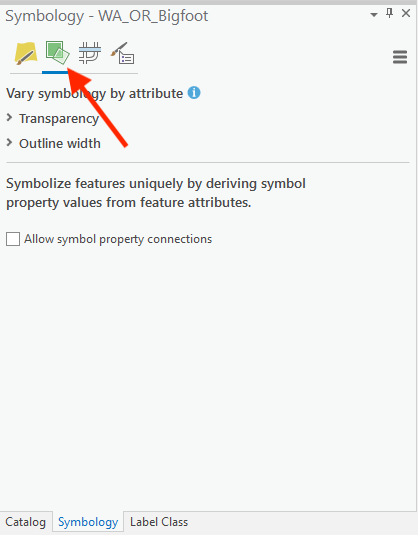
In a recent article we discussed various techniques you can use to create graduated color maps in ArcGIS Pro. We primarily focused on the basics of creating choropleth maps in ArcGIS Pro suing the Primary Symbology tab on the Symbology pane. Today we’re going to examine how you can vary symbology by attribute values using transparency and outline width functionality found on the “Vary symbology by attribute” tab on the Symbology pane seen in the screenshot below.
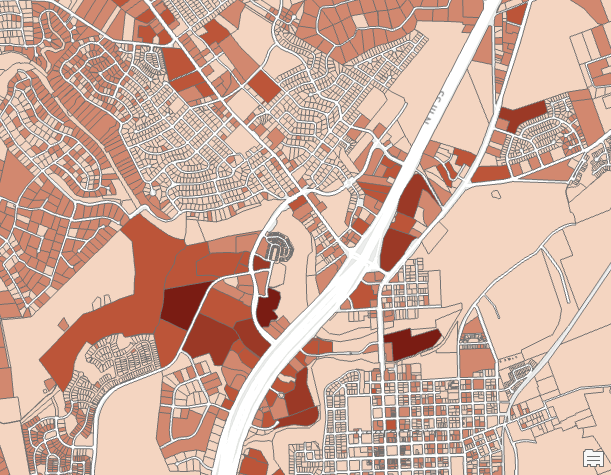
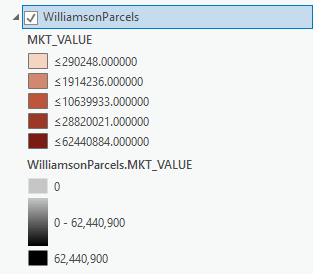
This tab includes functionality that will allow you to vary symbology by attribute by setting transparency and outline width. The example we’ll use in this article is a parcel layer that includes an attribute called MKT_VALUE, which is the assessed market value for a parcel including both the improvement and land values. In the last article in this series I created a graduated color map for this layer that divides the features into five classes using the Natural Breaks method. You can see this map in the screenshot below.
Using the Vary Symbology by Attribute Tab
This map does a good job of representing the market value of land parcels, but what if I wanted to enhance the visualization of these parcels so that land parcels with a higher value stand out more than lower value parcels? One way that I could do this would be to set variable transparency values.
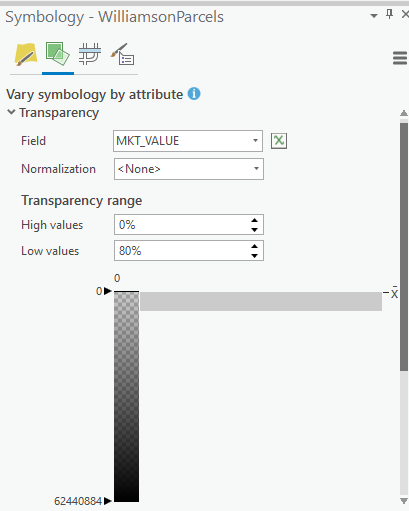
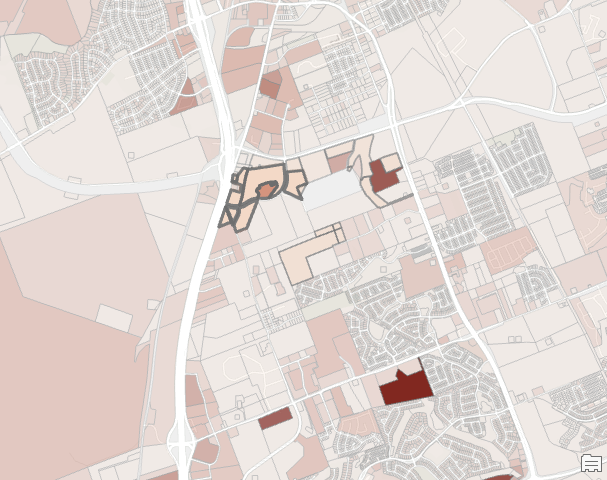
On the “Vary symbology by attribute” tab you can define transparency and normalization fields along with transparency ranges. In the screenshot below I have defined MKT_VALUE as the transparency field (no normalization in this case) as well as a transparency range. This will apply a very high transparency value (80%) to parcels with a low relative market value, and no transparency at all to the parcels with the highest values. All parcels will ultimately be assigned a transparency value between 0 – 80% depending on the value found in the MKT_VALUE field.
And here is the resulting map.
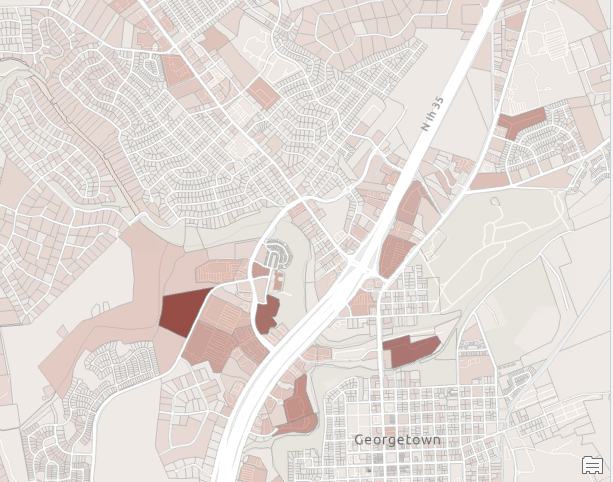
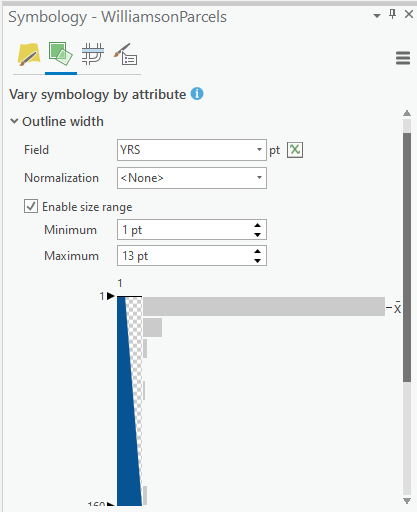
You can also vary the outline width of symbols based on the information found in an attribute field. This parcel dataset includes a YRS field that contains an integer indicating the number of years for which back taxes are owed. The higher the number, the more years of back taxes owed for a parcel. In the screenshot below I have selected YRS as the attribute field and enabled a size range between 1 and 13. These values will be used to assign the thickness of the outline width of each parcel. The thicker the outline width, the more years of back taxes owed.
Here is the result. Note how some parcels have much thicker outline widths. These are the parcels with more years of back taxes owed.
You can view a demonstration of the Vary Symbology by Attribute tab below.
Both functions we’ve discussed today include the ability to display a legend in the table of contents. A “Show legend” checkbox parameter is located at the bottom of the set of parameters for both functions. You can see an example below for setting variable transparency values.
Want to learn more about ArcGIS Pro? Take a look at our Online Training Bundles and Live Online Training events.
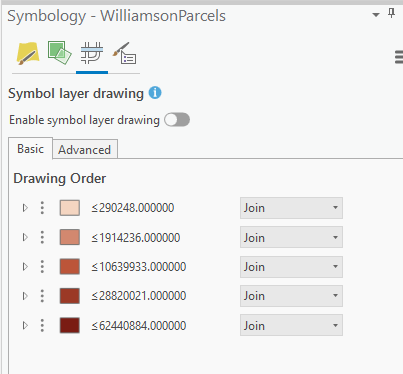
In the next article in this series we’ll cover the “Symbol layer drawing” tab (seen below) on the Symbology pane.