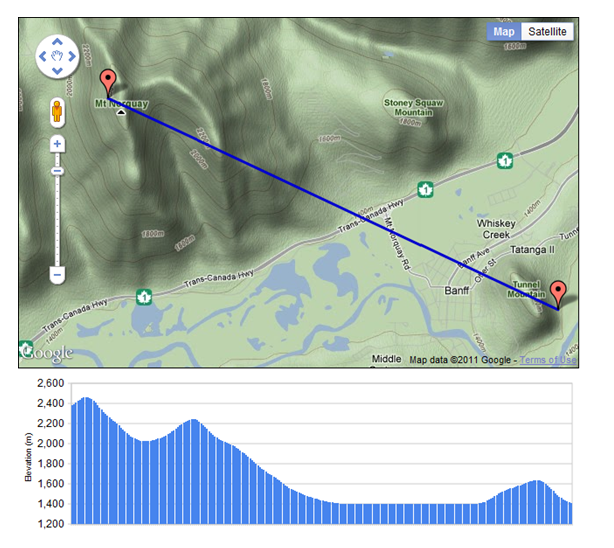
The Google Elevation Service provides elevation data for points on the surface of the Earth as well as sampled elevation data along paths. The ElevationService object is used to communicate with the service.
The process of obtaining elevation data about a location or path is similar to that of the geocoding process. A request object which can be either a LocationElevationRequest or PathElevationRequest object is created and passed to the ElevationService object.
Results are returned in the form of an ElevationResult object. The Elevation Service is asynchronous so you must provide a callback function to process the results that are returned. There is also an ElevationStatus object that you can query to determine the results of the request before further processing.
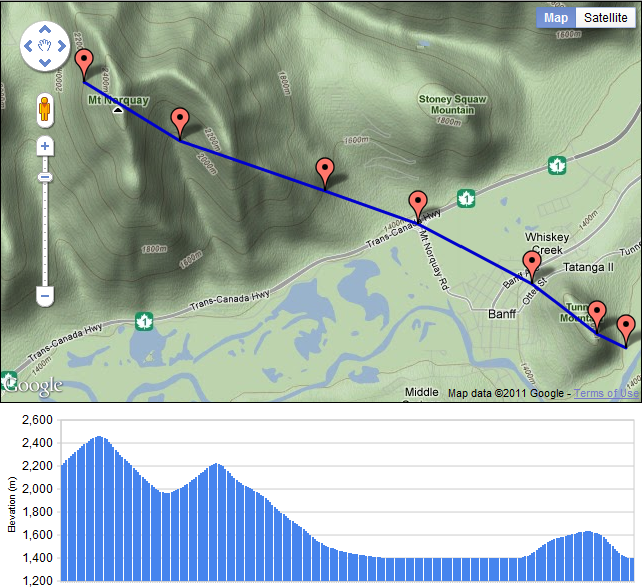
In this exercise you will learn how to use the Google Elevation Service to display the elevation profile of a polyline drawn across a map. In addition to the Google Maps API this exercise also uses the Google Visualization service to handle plotting the elevation profile in a chart. In addition to charting the elevation profile you’ll also write code to place Markers for each map click and also draw a polyline connecting the Markers.
Step 1: Open the Exercise File
- The exercise file can be downloaded here. Save the file to your computer.
- Open the file in your favorite HTML or text editor.
- So that you can focus on the sections of code related to the Elevation Service we have already written some of the code for this exercise. You can view the final result of this exercise here. Left click each point in the path and then right click to enter the final point.
Step 2: Create a new Instance of the Elevation Service
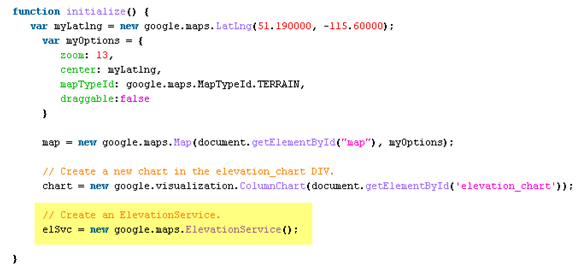
- Inside the initialize( ) function I want you to create a new instance of the ElevationService class using the line of code that you see below.
Step 3: Add Event Listeners
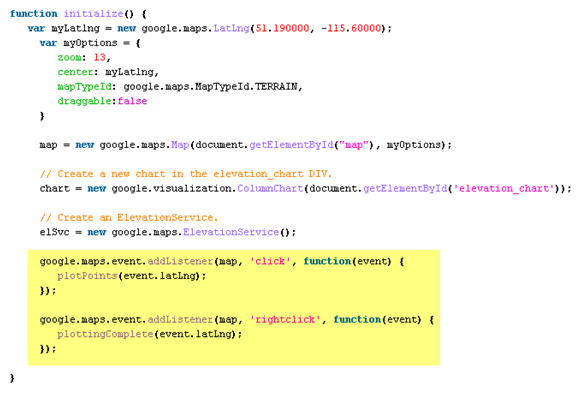
For this exercise you’ll need to create two event listeners; one for a map click (Map.click) and the other for a right mouse click (Map.rightclick) on the map. The intent of the Map.click event is to create a Marker object each time the user clicks the map and to add the LatLng objects of each click to an array which will later be used as input to the Elevation Service. The Map.rightclick event will signal that the user has finished placing points. In addition to creating the final Marker for the polyline this event handler will create a Polyline from the array of LatLng objects that were created and it will make a call to the ElevationService object to get the elevation along a path.
- Add the code that you see below to create the event handlers.
The first event listener (Map.click) calls the JavaScript function ‘plotPoints()’ while the second (Map.rightclick) calls the ‘plottingComplete()’ function. We haven’t created either of these functions yet so you won’t see them in your exercise file.
Step 4: Create plotPoints() JavaScript Function
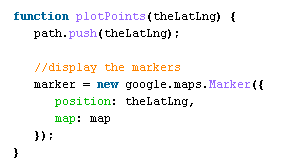
In this step you will write the ‘plotPoints()’ JavaScript function that adds a Marker to the map each time it is clicked. This function also adds the LatLng of the map click to an array which will be used as input to the ElevationService.
First, create the ‘path’ variable which is the array that will be populated by LatLng objects.
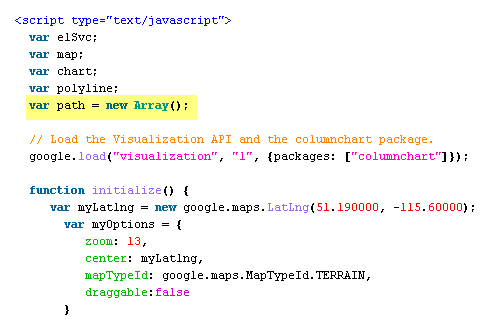
Here we use the ‘push’ method which is a JavaScript array method. This places each LatLng into the ‘path’ array. Next, we create a new Marker at the LatLng position.
Step 5: Creating the plottingComplete() Function
The ‘plottingComplete()’ function is triggered when the user right clicks the map display. Just as with the ‘plotPoints()’ function this function will also create a Marker where the map was clicked and push the LatLng object into the ‘path’ array. In addition, this function also create a Polyline connecting the Markers, creates the elevation service request, and calls the ElevationService.getElevationAlongPath() method.
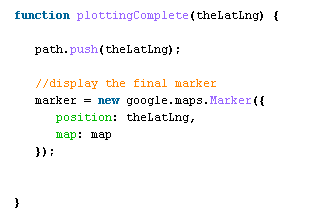
- Create the function, push the LatLng coordinate into the array, and create the Marker.
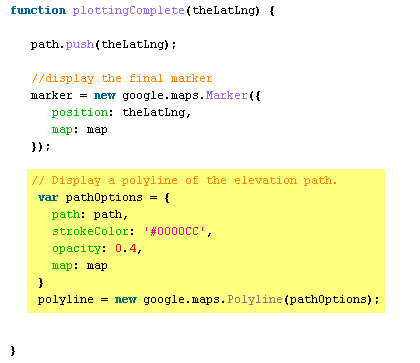
- Create the Polyline. A Polyline object in Google Maps accepts a PolylineOptions object in its constructor. This PolylineOptions object is used to define the path of the Polyline, the line color, transparency, and the map with which it is associated. Notice that the ‘path’ parameter is set to our ‘path’ variable.
- Create the request that will be submitted to the ElevationService. The request has two parameters: path and samples. The ‘path’ parameter defines the path for which the elevation profile should be generated and the ‘samples’ parameter indicates the number of sample points that should be taken.

- Finally, call the ElevationService.getElevationAlongPath() method as seen below. The request object (pathRequest) and a callback function (plotElevation) are passed as parameters to the method.

Step 6: Examine the ElevationService Return
The second parameter passed into the ElevationService.getElevationAlongPath() method (plotElevation) is the callback function that will process the results returned by the Elevation Service. The results are contained within an ElevationResult object. Since we’re determining the elevation along a path there will be multiple ElevationResult objects each of which contain elevation and location objects. We are interested in populating our Google Visualization Chart with the elevation for each point. The ‘plotElevations’ chart has already been written for you but it is helpful to examine this code to understand what is being accomplished.
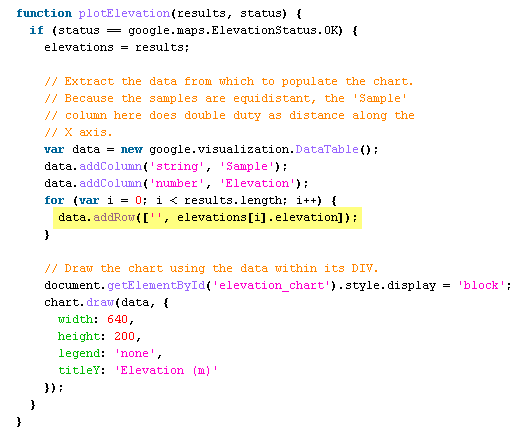
If the ElevationStatus returned a message of ‘OK’ then we assign the ElevationResults to the ‘elevations’ variable. We then create a DataTable from the Visualization library that will serve as the data source for the chart. Inside this DataTable we add rows corresponding to the sample locations and elevations for each location. Notice in the highlighted line of code that we are pulling out the ‘elevation’ property from the ElevationResult. Finally, we draw the Google Visualization chart using the DataTable.
Step 7: View the Results

