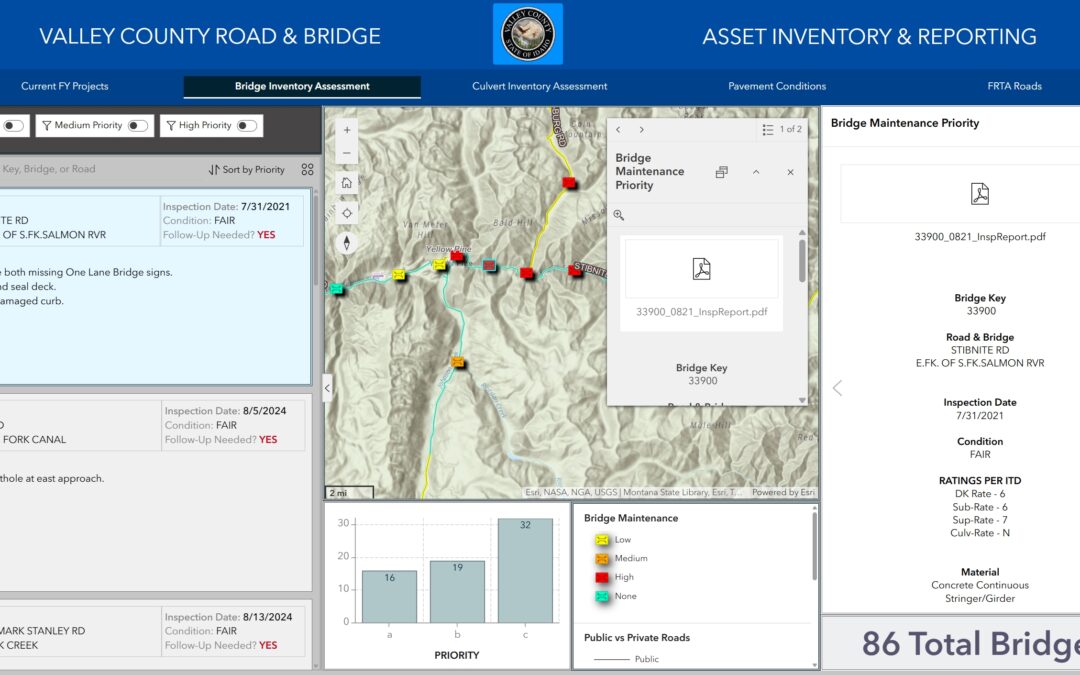
Widget Strategies for Data-Driven Dashboards in Experience Builder
Data-driven dashboards are interactive interfaces that allow users to visualize and analyze data in real-time. By integrating widgets effectively in Experience Builder, you can enhance interactivity, improve usability, and create visually compelling dashboards that...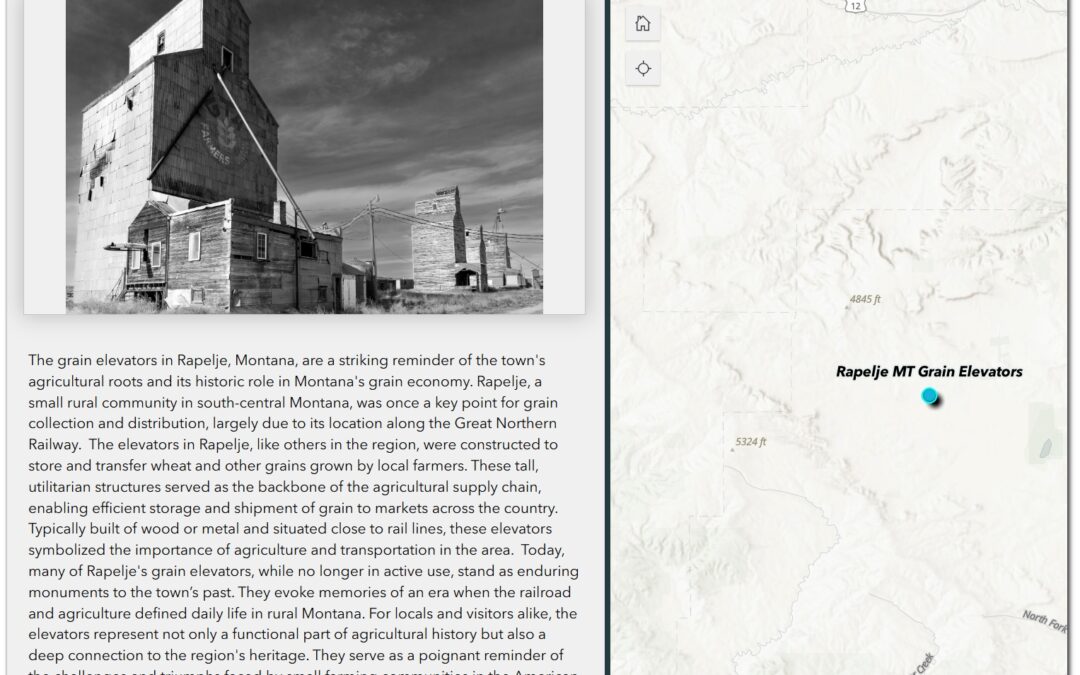
Widget-Driven Design for Storytelling with Experience Builder
Storytelling in GIS involves creating engaging narratives that link spatial data with visuals and meaningful insights. Experience Builder offers a range of widgets to help users design interactive, visually compelling applications for storytelling. In this tutorial,...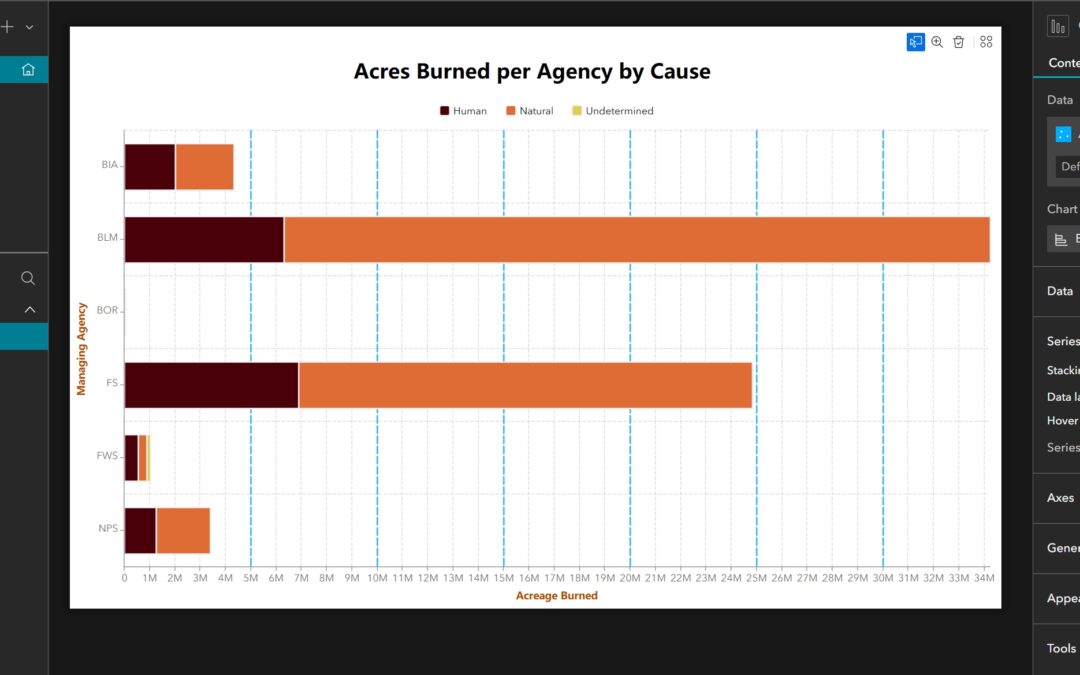
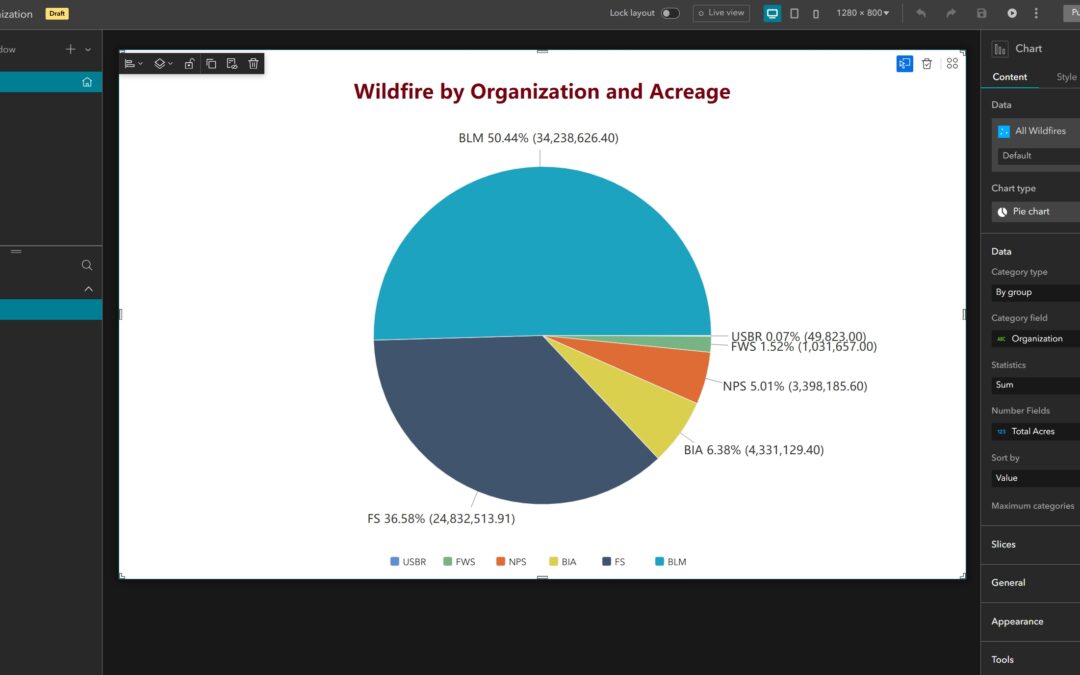
How to Customize a Stacked Bar Chart with a Split-By in Experience Builder
Learn more about our Experience Builder courses and upcoming training schedule. In a previous tutorial, we described the steps and options for configuring a modern pie chart in Experience Builder. In this tutorial, we will use Wildfire data from between 1984 and 2016...