

While the ArcGIS Arcade language has been around for awhile now most GIS professionals haven’t yet taken the time to examine how this simple expression language can be used to dynamically produce content and visualization for both ArcGIS Pro and ArcGIS Online. Arcade can be used to assist with labeling, symbology rendering, field calculation, and pop-up content. Dynamic labeling and visualization has become a lot easier with the release of Arcade. What makes Arcade unique is that the expressions are portable, so that they can be used through the whole ArcGIS Platform. Scripts you create in ArcGIS Pro can also be read and executed via a WebMap in traditional browser or mobile applications or via the JavaScript API for ArcGIS.
Response to a Common Problem
Arcade is a response to a common problem. How do you display data when there is no column in the schema containing that data? Up until now, if the map layer you are working with did not have exactly the right attribute data you need, you had two choices:
- Alter the underlying data, or
- Bring in the services of an application developer
ArcGIS Arcade has a simple scripting syntax that enables you to manipulate your existing data to generate new information based on it. While this sort of functionality has always been available in certain Esri products – most notably Desktop – the aim behind Arcade is to make it available everywhere in the ArcGIS platform, and for it to work identically in all environments. You can almost think of Arcade as “Excel for ArcGIS”. In much the same way as Excel lets you write formula to work with spreadsheet data, Arcade lets you do the same with map data.
Arcade Profiles
The situations in which you can use the Arcade expression language are known as profiles. Quite simply, a profile is a context in which an Arcade expression can be evaluated and understood. Currently there are five such profiles: visualization, labeling, pop-up, field calculate, and aliases.
- The visualization profile lets you take the data you already have and use it in expressions to determine how to render that data.
- The labeling profile lets you specify which label a particular feature should show, and how that label should be formatted.
- The pop-up profile lets you specify content for a popup specific to a particular feature.
- The field calculate profile performs field attribute calculation.
- The alias profile lets you access numeric data and manipulate it to return a string.
Visualization Profile Example
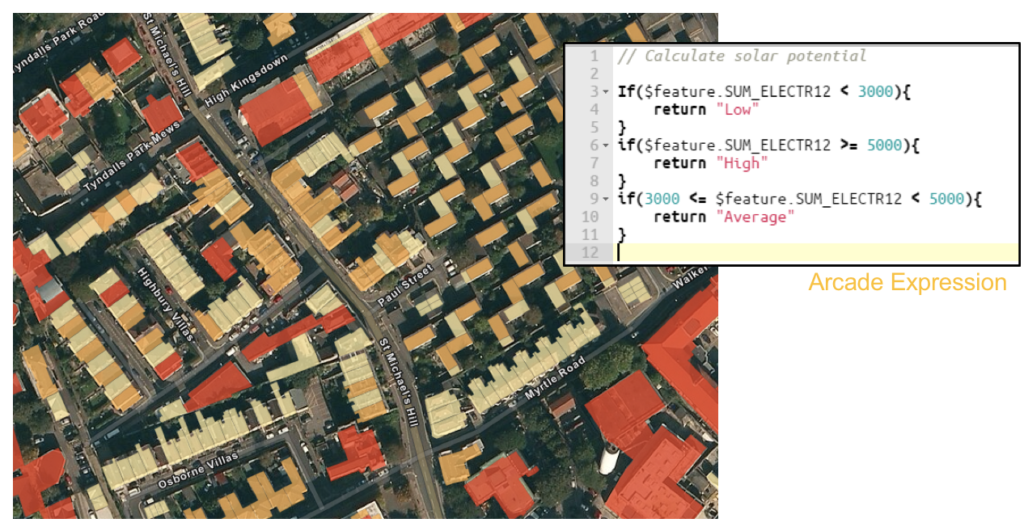
Let’s show what is probably the most common use case for Arcade first. The map in the screenshot below shows the solar energy potential for various buildings in Bristol, England. The Arcade expression used to create this information is shown in the inset. It just examines the value of the field which corresponds to the photovoltaic generation potential in Kilowatt Hours per year and, based upon it, returns either Low, Average or High which is used to render the building footprints accordingly. Note that Low, Average, or High are not values available in an existing attribute field in the source map. They are being dynamically evaluated at runtime. You could extend this example to render areas of the city based on average solar potential in each area. You wouldn’t need to add this information to the attribute data, you could just use Arcade to evaluate it on the fly based on data you already have.
Arcade Syntax
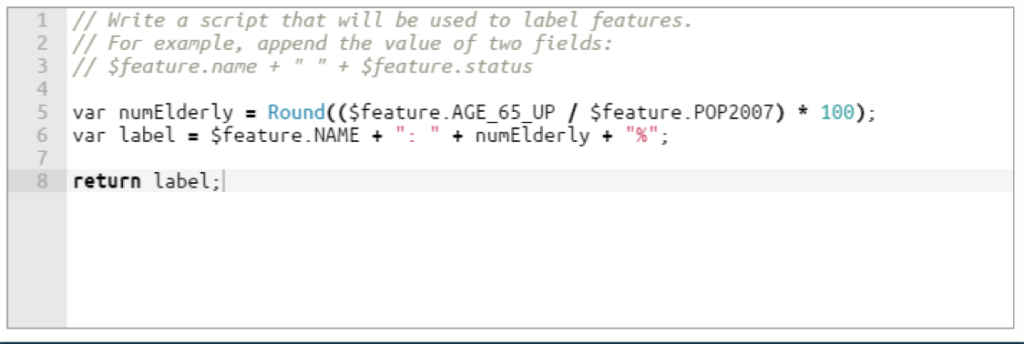
Arcade’s syntax looks similar to JavaScript. In a similar fashion as JavaScript, Arcade enables you to declare variables, perform logical operations, take advantage of built-in functions, and write custom functions. Data is referred to through globals (short for global variables). These start with a dollar sign and represent features from a service or layer, and contain a geometry and set of attributes. Global variables enable you to perform simple calculations using field values at runtime. You can see examples of this in the code below. The $feature prefix is a global variable that refers to the current feature and is followed by the dot operator and then the name of an attribute column associated with that feature. Here, the Round() function, part of the Arcade language, is being used to round the result. Variables are defined with the var keyword and information is returned with the return statement.
Arcade is Multi-Platform
The power of Arcade comes from the fact that it is multi –platform, with the ability to run everywhere on nearly every device powered by a rich set of apps. For that to work properly, each of these apps needs to speak the same language, and that’s the goal behind Arcade.
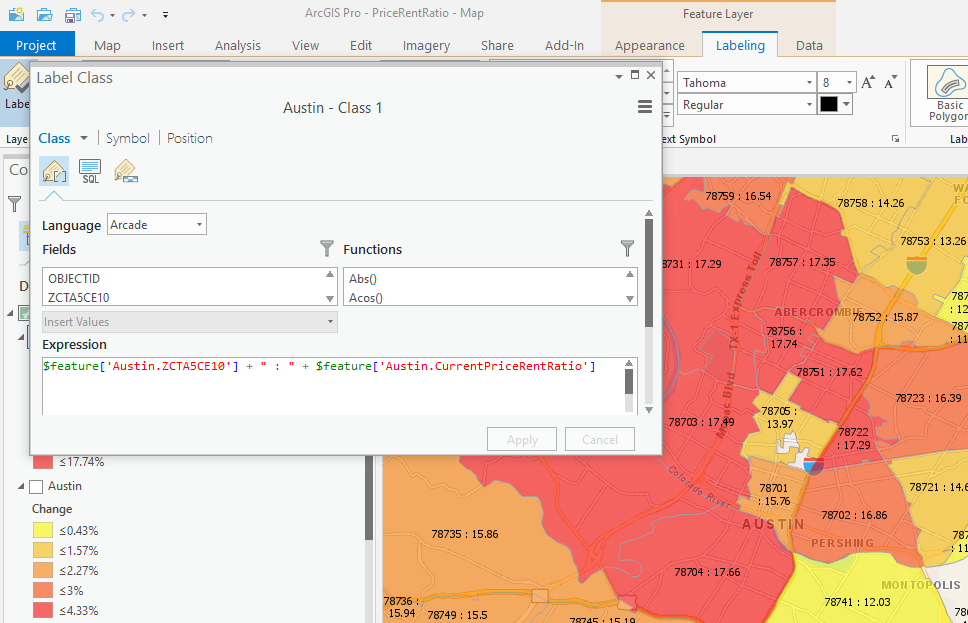
Anything that Arcade can do you can do in ArcGIS Pro, or write custom code for using one of the APIs, runtime SDKs, or Python scripting language. But the end goal is to have Arcade as a common expression language that you can use in all ArcGIS environments. The screenshot below depicts a simple Arcade expression written in ArcGIS Pro using the labeling profile.
Currently you can use Arcade expressions in ArcGIS Pro, ArcGIS Online, and any custom applications you build using the JavaScript API or runtime SDKs. But Esri ultimately wants all ArcGIS software to be able to recognize and evaluate Arcade expressions. Arcade is not ever going to replace anything, it’s just going to make writing and sharing expressions in each of these environments easier.
ArcGIS Arcade Classes
Want to learn more about ArcGIS Arcade? Check out our Getting Started with ArcGIS Arcade class. This class is also bundled with our ArcGIS Pro Bundle.
