

Today’s post will be the first in a series designed to introduce the reader to a typical spatial analytics project using the Spatial Statistics toolbox in ArcGIS along with the R and Python programming languages. We’re going to apply various spatial analytics techniques to wildfire activity in the United States.
As any experienced GIS practitioner understands, a large percentage of the time and effort in any GIS project (or data science project) is spent acquiring, cleaning, and organizing data. The real world, and it’s data, is messy! A recent data science survey found that data scientists spend 60% of their time cleaning data. Frankly I think that might be on the low side, at least for GIS projects. This project will be no different. In this first post we’re going to acquire the dataset that will be used in our project. Future posts will cover the use of various spatial statistics tools for the analysis of wildfire data.
For this project we’re going to apply various spatial analytics techniques to the study of wildfire activity for the United States. Our first task is to find the data that will support this project. Fortunately, the USGS provides an open ArcGIS Server map service that contains a number of layers including historical layers going back to 2002. The link I provided will take you to the service directory which should appear as seen in the screenshot below.
Note: It appears that you can no longer use this USGS service to download the wildfire datasets by year as described below so I have provided a link to a geodatabase containing the wildfire data by year. This is a Dropbox link. You’ll want to download and unzip, and then you can skip the next section and continue with the heading Comparing the Attribute Tables below.
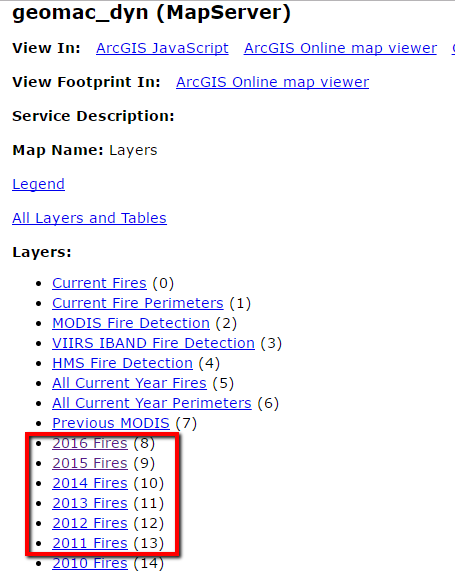
You may also want to view this map service in ArcGIS Desktop to get a better feel for the data. You can add ArcGIS Server services as layers in ArcGIS Desktop by going to the Add Data button and selecting Look In. Select Add ArcGIS Server and then enter the url for the USGS service that I provided. We’re primarily going to be interested in the historical layers including 2016 Fires all the way back to 2002 Fires.
Downloading the Data
Note: It appears that you can no longer use this USGS service to download the wildfire datasets by year as described below so I have provided a link to a geodatabase containing the wildfire data by year. This is a Dropbox link. You’ll want to download and unzip, and then you can skip this section and continue with the heading Comparing the Attribute Tables below.
We’re going to download the point layers for fires from 2002 through 2016.
- We’re going to download the point layers to local feature classes. Before we do that you’ll need to create a file geodatabase to hold each of the feature classes. Use Catalog to create a new file geodatabase and name it UGSS Wildfire Data. You can put the geodatabase wherever you’d like. I created a WildfireData folder on my C: drive, but you can put it wherever you’d like.
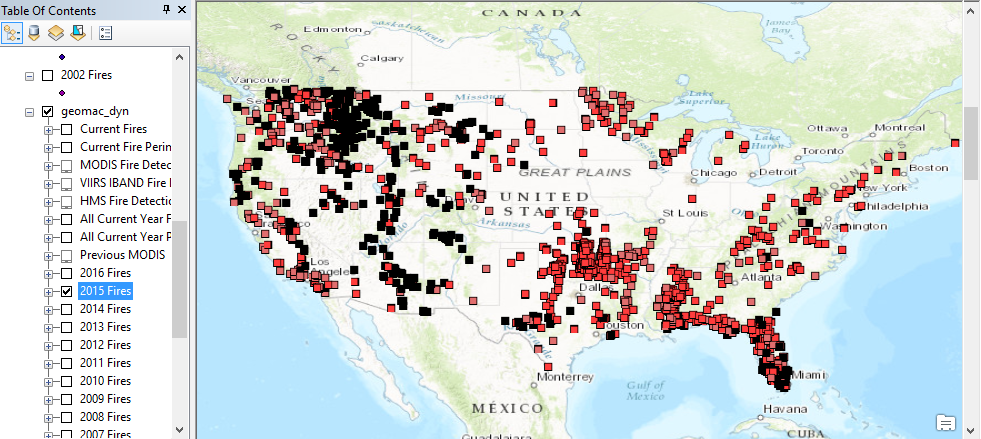
- If you haven’t already done so, start ArcMap and add the map service as a layer.
- In the ArcMap table of contents switch to List by Selection.
- Under the list of selectable layers you should see layers for each year.
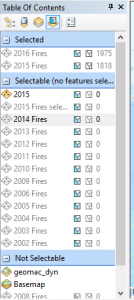
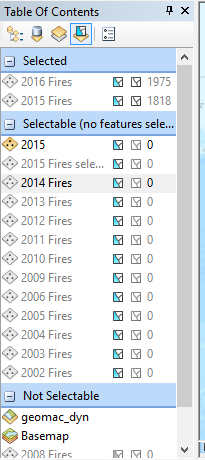
- For each year from 2002 through 2016, right click the layer and select Select All. This will select all features in the layer and will add the layer to the Selected pane along with the total number of records that were selected. You can see an example of this is in the screenshot below.
- After selecting all the features for each layer, switch to List by Drawing Order.
- For each layer from 2012 to 2016, right click the layer and select Data | Export Data.
- Export each layer as a new feature class in the USGS Wildfire Data geodatabase that you created. Name them using the format Fires<Year>.
- At the end of this process you should have individual feature classes for the years 2002 through 2016.
I did find another interesting tool for exporting ArcGIS Server map service layers to shapefiles. It’s called AGStoShapefile. While I prefer to use a geodatabase instead of a shapefile for a number of reasons it does have the added benefit of also creating geojson and json files in addition to shapefiles. You can check out the AGStoShapefile tool for more information. It does require an installation of Node.js along with gdal and some configuration but the tools works well and is an alternative to using ArcGIS.
Comparing the Attribute Tables
One thing we’re going to want to do is append the individual 2002-2016 feature classes into a single feature class that covers the entire time period. The ArcGIS Append and Merge tools can both be used to accomplish this task. The difference between the two is that Append takes multiple input datasets and appends them to an existing feature class while Merge takes multiple input datasets and creates a new output dataset. In this case we’re going to create a new, empty feature class to hold the features, which means we’re going to use the Append tool. One of the parameters for the Append tool is an optional Field Mappings parameter, which is used to match up fields from the input layers to the output layer.
This next point is important! When appending a large number of feature classes it is very common to have differences in the fields that are attached to the attribute tables. Fields can have different names and/or types, and it is also common to have a difference in the number of fields. You might not think that would be the case since all the data is coming from the same map service provided by the same federal agency, but as you’ll soon see (and you already know this is you’ve been working on GIS projects for long) it is common to have differences in the attribute schemas of different layers even though they are essentially presenting the same type of data.
Since we’re dealing with a fairly large number of feature classes that will be appended it presents something of a problem to try to compare the attribute schemas for these layers. To help with comparing the attribute schemas I’ve written a quick and dirty Python script that will compare the attribute schemas of two feature classes. I’m not going to go into the details of this script, but basically it examines attribute schemas of two feature classes and reports any differences. If you want to test the script you just need to set the arcpy.env.workspace variable along with the featureclass1 and featureclass2 variables and run the script to see the output. ArcGIS includes a Table Compare tool, but it didn’t provide enough detail for this particular project.
I wound up running this script a number of times to examine the differences in the attributes of the feature classes, and the end result is that we have several groupings of attribute schemas that are alike.
- The years 2002, 2003, and 2004 all have the same structure
- The years 2005-2014 all have the same basic structure with some very minor differences. 2015 was similar, but with more differences.
- 2016 seems to be a new schema that differs significantly from all the others.
You can take a look at this Google Doc to see the attribute schemas and differences.
Defining the Attribute Schema for the Merged Wildfire Feature Class
For our purposes in this spatial analysis we don’t need all the attribute fields from the individual feature classes. Below is a list of attributes that we’d like to include in the wildfire feature class that will contain records from all the years between 2002 and 2016.
- Fire name (firename)
- Fire reported data (reportdate)
- Fire year (reportyear)
- Fire cause (firecause)
- Fire state (state)
- Latitude (latitude)
- Longitude (longitude)
- Acres burned (acres)
We can go ahead and create our new (empty) feature class in the USGS Wildfire Data geodatabase with the attribute schema that includes the attributes we just mentioned.
- Right click the geodatabase and select New Feature Class.
- Give it a name of HistoricalWildfires and make it a Point feature class.
- For now just define the coordinate system as GCS_WGS_1984. We’ll project this feature class in a future exercise before we begin using the spatial statistics tools.
- Accept the defaults until you get to the dialog that asks you to define the field names.
- Add the following field names and data types. These will correspond to the list of attributes we defined above.
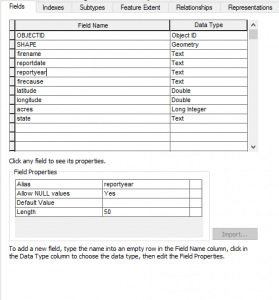
- Click OK and you should now see a HistoricalWildfires feature class in the USGS Wildfire Data geodatabase. Right now it’s empty but we’ll begin appending data soon.
Loading the Data Using the Append Tool
What we need to do now is map (not that kind of map) the list of attributes we just created in the HistoricalWildfires feature class to the attributes in the annual wildfire feature classes. Go back and review the Google Doc containing the attributes for each wildfire feature class to see if you can find the matching attributes. They won’t always have the same attribute name, but in most cases you’ll be able to find a similar field. Because the attribute schema from 2016 is significantly different from the rest of the years we’re going to leave this year out for now.
- Find the Append tool in ArcToolbox and open it.
- For now we’ll just define a single layer to append. For the input dataset select Fires2002. Set the Target Dataset as HistoricalWildfires. Set the Schema_Type as NO_TEST. Finally, define the Field Map settings by right clicking on any field that doesn’t already have a field mapped and select the field from the Fires2002 feature class. See the screenshot below for more information.
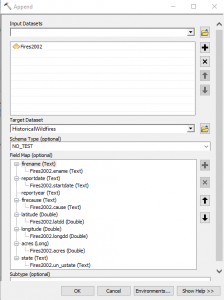
Not every field in the new feature class will have a corresponding field to map to. For example, the reportyear field does not have a corresponding field in the Fires2002 layer. We’ll fill that in using the Field Calculator after the import. - Click OK to execute the tool.
- Repeat the process of appending each year to the HistoricalWildfires feature class for the years 2003 through 2015.
- After appending wildfires for the year 2002 through 2015 you should have 36,321 records in the HistoricalWildfires feature class. Your may have a slightly different number of records. Open the attribute table to ensure that the attributes have been imported as well.


Data Cleanup
It is very common for some cleanup to be done on the attributes. We don’t have a lot of attributes in our dataset, but we do still need to add the attributes for the reportyear field and as you’ll see we need to clean up some of the values in the firecause and reportdate fields.
- We’ll start with the reportdate field. Part of our analysis will include temporal as well as spatial analysis, so any records that contain Null values for the reportdate are going to be removed from the dataset that will be used for the temporal analysis. Use the Select by Attributes tool in ArcMap to select records where the reportdate is Null. Then with the attribute table open for the HistoricalWildfires feature class, use the Switch Selection operation to select 34,346 records.
- Export these 34,346 records to a new feature class called HistoricalWildfiresTemporal in the USGS Wildfire Data geodatabase. We’ll use the HistoricalWildfiresTemporal feature class in a later exercise, but for now we’ll return to doing data cleanup on the HistoricalWildfires feature class.
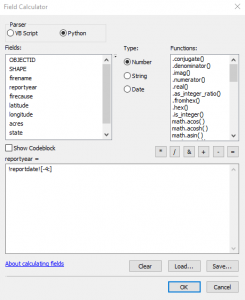
- Now we’ll return our attention to the HistoricalWildfires feature class. We’ll examine the reportyear field. We can populate the attributes for this field by pulling the last 4 characters from the reportdate field, which contains the reported data of the fire in MM/DD/YYYY format. Right click on the reportdate field and select Field Calculator. In the Field Calculator select Python as the parser and then double click the reportdate field and add the code [: -4] to the end of !reportdate! in the code window. Take a look at the screenshot below to make sure you have done this correctly. The code we have entered is a small Python snippet that will read the contents of the reportdate field from right to left. When using Python to read a string from right to left you use negative numbers. Since we’ve defined a value of -4 it will essentially pull 4 characters from the far right of the string.
- Click OK to execute the code and if you’ve done this correctly it should fill in the year reportyear field for each record.
- We also need to clean up the attributes of the firecause field. If you take a look at the unique values for this field you’ll find the following: ‘H’, ‘Human’, ‘L’, ‘N’, ‘Natural’, ‘O’, ‘U’, ‘Undetermined’, and ‘ ‘. The ‘H’ and ‘Human’ values are both referring to human caused fires. The ‘N’ and ‘Natural’ values are referring to naturally caused fires, and ‘U’ and ‘Undetermined’ both defining an undetermined reason for the fire. To keep our data values consistent we’ll convert the ‘Human’, ‘Natural’, and ‘Undetermined’ to their one character equivalents. The ‘L’ value refers to Lightning caused fires. Use the Select by Attributes tool to select records where the firecause field is equal to ‘Human’.
- Use the Field Calculator to set the firecause field equal to ‘H’ for these selected features.
- Repeat these last two steps to do the same for the ‘Natural’ and ‘Undetermined’ values in the firecause field.
- This should leave only the values of ‘H’, ‘L’, ‘N’,’ ‘O’, ‘U’.
- Next we’ll remove any records that have missing values for some of the attribute fields. Use the Select by Attribute tool to select any records from the HistoricalWildfires feature class that have Null or empty values for the firename, or reportdate, or latitude/longitude fields with a value of 0. This should select 64 records though your count may be slightly different. Use the Editing toolbar in ArcMap to delete these records.
- Finally, we need to remove duplicate wildfire records for the feature class. If you take a look at the HistoricalWildfires feature class attribute table you’ll find that it is not uncommon to have multiple records for the same fire. A good example is the ‘Applegate‘ fire. Sort the records by firename and then scroll down until you find the Applegate fire. It is certainly possible to have the same fire name in multiple states and as you’ll see, there is a listing for this fire name in both Alaska and California. It’s also possible that you might have the same fire name in the same state but in a different year. Therefore, we need a way of identifying duplicates records based on the firename, reportyear, and state fields. If you have an Advanced license of ArcGIS Desktop you’re in luck! The Delete Identical tool can be used to accomplish this task. It deletes records from a feature class or table which have identical values in a list of fields. You can even compare geometries if needed. Unfortunately I do not have an Advanced license of ArcGIS Desktop, and many of you probably don’t either, so we are going to have to identify the duplicates using a Python script. You’re in luck in this case as well as I have already written a Python script that you can download here. This script does require a duplicate field in the attribute table for the HistoricalWildfires feature class so add that first as a short integer before you run the script. It will the field with values of 0 and 1. A value of 1 indicates that the record is a duplicate.
- If you ran the Python script and not the Delete Identical tool in the last step you’ll now need to delete any records that contain a value of 1 in the duplicate field. Use the Select by Attributes tool to select these records. Start and Editing session and delete the selected records. Save the edits. That should leave 25,267 unique records. If you used the Delete Identical tool instead of the script it should in theory leave the same number of records but since I don’t have an Advanced license of ArcGIS Desktop I haven’t been able to test this.

Conclusion
In this first article we’ve downloaded wildfire point feature classes from a USGS map service for the years 2002-2016, created a new HistoricalWildfires feature class and appended each of the annual wildfire feature classes to this comprehensive dataset of wildfires for those years, and done some data cleanup. In the next article we’ll perform some additional data management and begin using spatial statistics tools to examine our dataset.
More information on Spatial Analytics:
- Need help with a spatial analytics, data science, or data visualization project? Get more information on our consulting services.
- Class – Introduction to Spatial Statistics using ArcGIS and R
- Class – Python for Data Science I: Python programming and efficient data management (Pandas)
- Class – R for Data Science I: R Programming and Efficient Data Management
- Book – Spatial Analytics in ArcGIS
- Services – Spatial Statistics and Data Science
