

Statistics show that wildland fires are igniting more frequently and causing more damage with each passing year. From the forest-surrounded communities of the western landscape and rural grasslands of the Midwest to the eastern states and wild areas of our National Forests and Parks. Due to the frequency of fire throughout the year, many local governments, federal employees, and public safety managers need quick access to the most current Wildland Fire data. Luckily the Living Atlas has just what we need.
In this quick article we will tell you how to connect directly to the USA Current Wildfires hosted feature service for viewing in your ArcGIS Pro maps and layouts. Directly streaming authoritative data means you don’t have to maintain copies of the data. This is beneficial because copies of data would become outdated within hours of downloading them.
When you follow the directions below, you will be connecting to a live feed of the original data so when updates are made by the authoritative agencies, the data you see in your maps will also be updated.
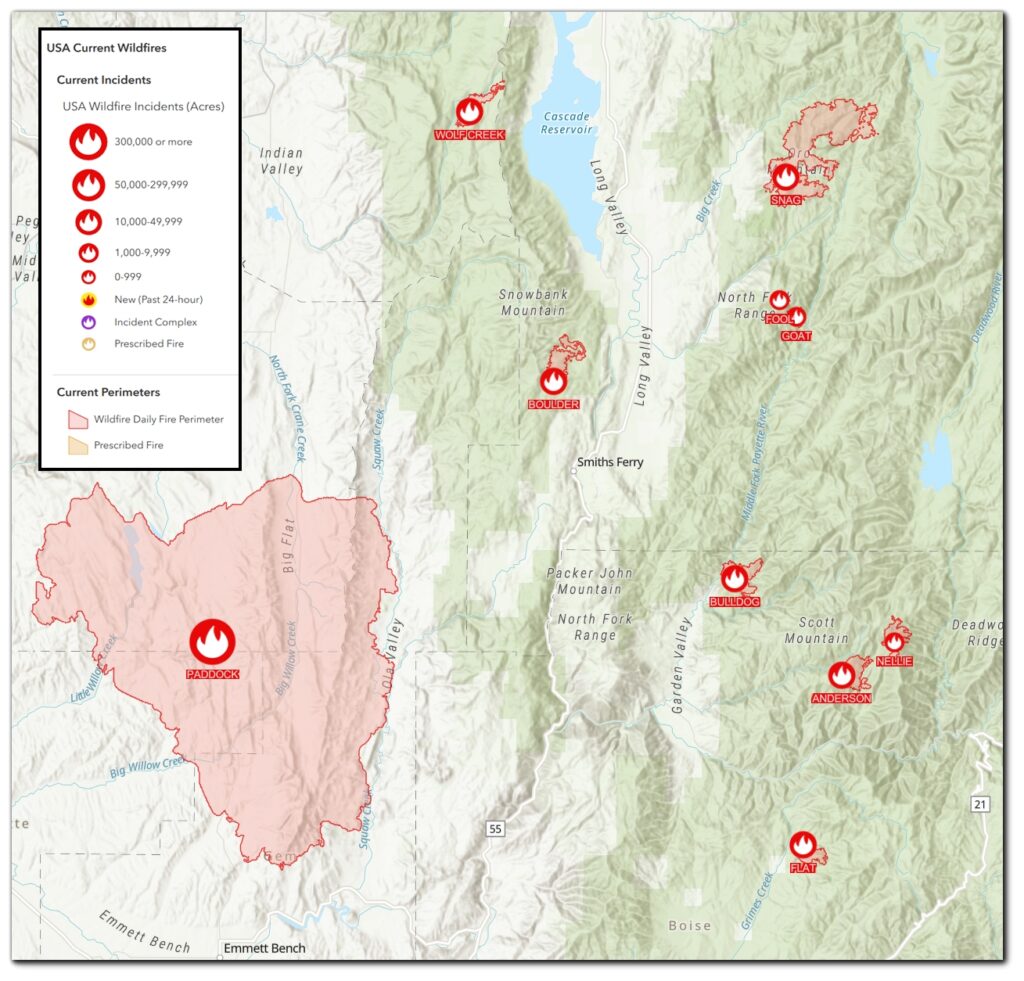
What is the USA Current Wildfires group layer?
The USA Current Wildfires hosted feature service includes two layers. The first is the Current Wildfire points which are most often located at the point of ignition. The second layer consists of wildfire perimeters. The data for this Nationwide layer is updated every 15 minutes via a script, but the details associated with the Wildfires in closest proximity to your areas will be updated by the GISS Incident Command teams that are managing that particular fire’s data. This can be multiple times a day, or once a day. Regardless, it will be one of the easiest ways to access the most up-to-date information for your communities and decision-makers.
Where is the data being pulled from?
Wildfire points are sourced from Integrated Reporting of Wildland-Fire Information (IRWIN) and perimeters from National Interagency Fire Center (NIFC). ESRI has created a script that pulls and aggregates the data for consumption by ArcGIS Pro and ArcGIS Online users.
The below information can also be found in the hosted feature service overview page:
“Current Incidents: This layer provides a near real-time view of the data being shared through the Integrated Reporting of Wildland-Fire Information (IRWIN) service. IRWIN provides data exchange capabilities between participating wildfire systems, including federal, state and local agencies. Data is synchronized across participating organizations to make sure the most current information is available. The display of the points are based on the NWCG Fire Size Classification applied to the daily acres attribute.
Current Perimeters: This layer displays fire perimeters posted to the National Incident Feature Service. It is updated from operational data and may not reflect current conditions on the ground. For a better understanding of the workflows involved in mapping and sharing fire perimeter data, see the National Wildfire Coordinating Group Standards for Geospatial Operations.”
How do I pull this layer into my ArcGIS Pro map?
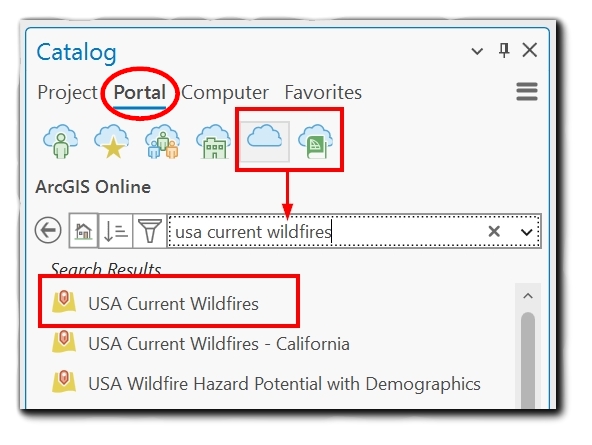
STEP 1 – Make sure you are on the Portal tab in the Catalog Pane in the ArcGIS Pro project you want to pull the data into.
STEP 2 – From the Portal tab, you can search Living Atlas layers from either the ArcGIS Online or Living Atlas portal options. For those of you who don’t know, the Living Atlas is ESRI’s solution for hosting content that will positively impact a large population. This means they have decided to shoulder the costs of hosting certain data due to the benefits for ArcGIS users.
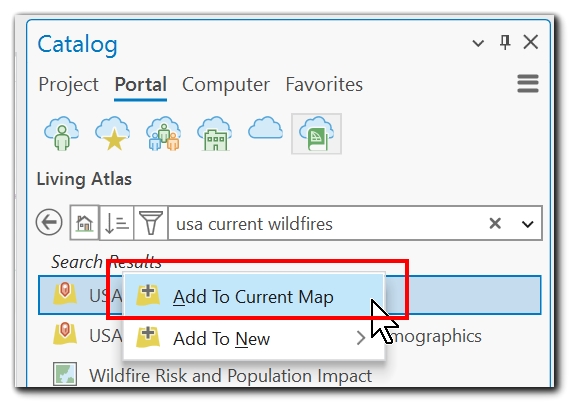
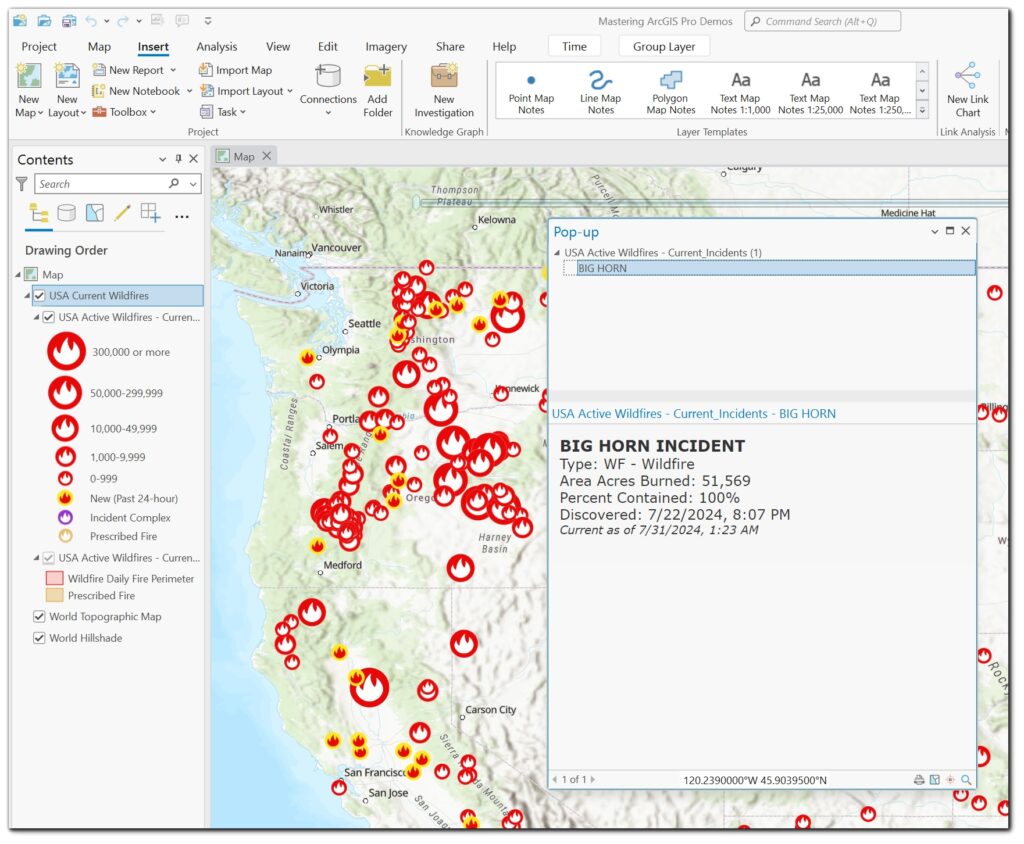
STEP 3 – Right click on the ‘USA Current Wildfires’ feature service that appears in the search results and click “Add to Current Map”. From there you will be able to create maps, run analyses, and alter any labels or symbols that you want to alter to make it more meaningful for your projects and reports. Once the layer is added, you can also click on features in the map to view pop-ups that have already been configured for your benefit. Change these pop-ups as needed to meet your needs.
Summary
In today’s technology-based world, information is more accessible than ever before. When it comes to important data, such as USA Current Wildfires, we are grateful for the quick and easy access we have to connect to and view authoritative data. In addition, we will see updated data as soon as the updates are made to the original features because we are streaming the data live and not downloading a copy of the data.
