
Learn more about our Experience Builder courses and upcoming training schedule.
As usual, my finger became exhausted when scrolling through ESRI’s “What’s New in Experience Builder” page. Not that I’m complaining about the lengthy list of enhancements that comes out with each iteration of Experience Builder! Because with each iteration, our favorite online application builder gets even more awesome. From new widgets and functionality to data and statistical summary enhancements, we have hand-picked some of our favorite updates and summarized them below.
New Widgets for Reporting and Measurements
Before now, Experience Builder lacked reporting options and control over measurement parameters and default units. Below we will discuss two enhancements that provide us more flexibility relative to reporting and measurements.
Feature Report Widget
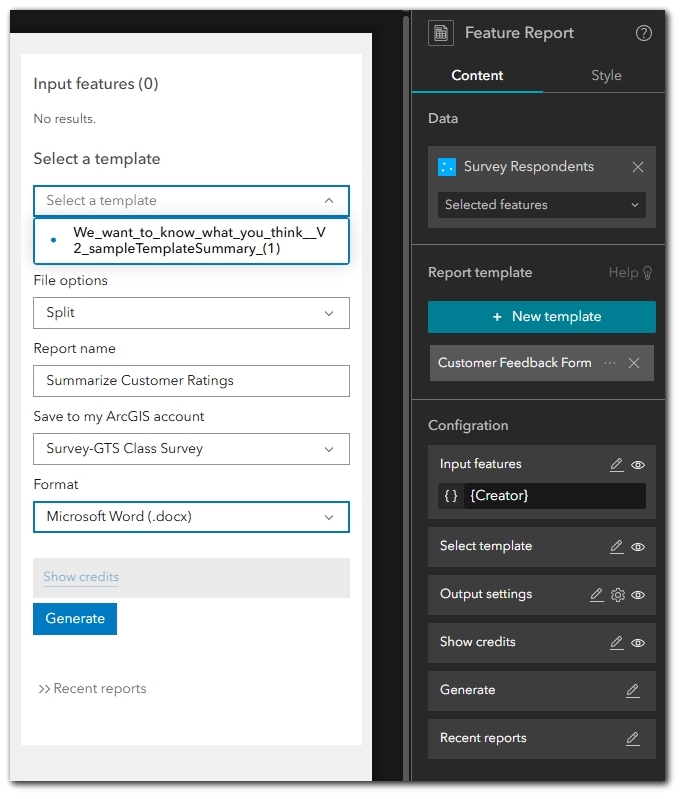
Now, the new Feature Report widget allows you to connect to your Survey123 data and report templates for a streamlined user workflow. Survey123 can be integrated into Experience Builder in many ways, including embedded surveys, interactions between the Table widget and Survey123 widgets, and now with the addition of Feature Reporting it is becoming clear that Survey123 may be the way to go for more complex workflows. If you are considering using this widget, it is important to note that it will consume credits at runtime so be sure and calculate and budget for credit consumption ahead of time.
Measurement Widget
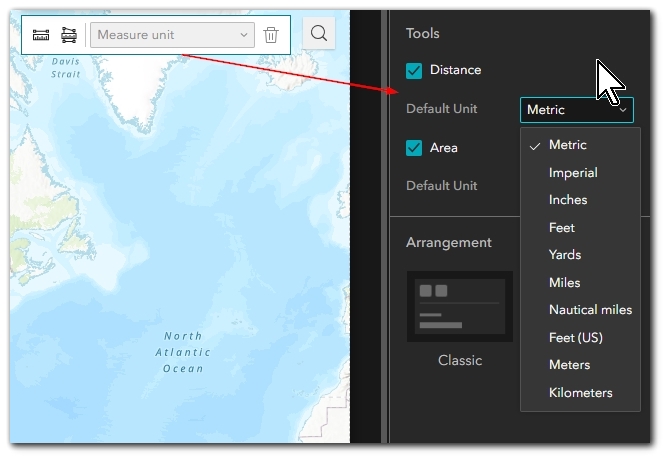
Measuring was already possible in Experience Builder within the Map widget. However, customizing some of the parameters is not possible. You can either turn measuring on in the map or leave it off. Now, with the addition of the Measurement widget, you can set default units for measuring distance and area. For us, we consider this a huge leap forward because it allows us to streamline the workflow for our users based on their needs, instead of forcing them to click and choose a unit each time they want to measure something in the map.
Statistical Summaries
There have been two big advancements in statistical summary outputs this year in Experience Builder which we will discuss here.
Data Action: Statistics
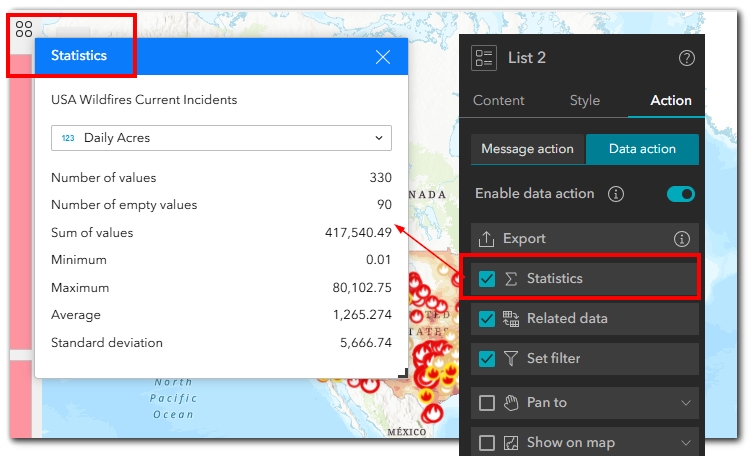
In a previous update, ESRI included an exciting summary statistics option for any widget that allows Data Actions. It’s easy to use and quickly provides incredibly meaningful information. If you view the image below, you will see the Data Action option of “Statistics” has been enabled (right) and the summary statistics window that a user can open in the application at runtime (left). The user chooses to open the statistics window and then chooses the field they want to see summary statistics for. This quick statistical summary is quite meaningful and provides commonly sought after statistics with just a couple of clicks. You only enable or disable the statistics; you cannot customize any settings.
Dynamic Content: Statistics and Expressions
In the most recent update, we have seen an enhancement in the available Statistical operators relative to Dynamic Content. For those of you who aren’t yet familiar, Dynamic Content can be configured using the Text widget and allows you to connect to the attribute data present in a dataset. This is how you would create those super useful statistical infographics that are most often seen in dashboards.
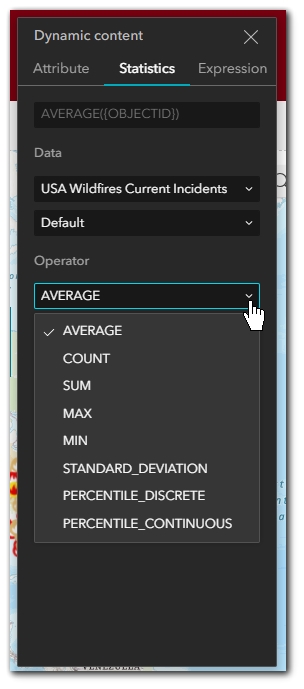
In the image below, you can see the newest additions to the statistical operators, which are Standard Deviation, Percentile Discrete, and Percentile Continuous. Each of these operators is beneficial and meaningful. For example, your users may need to understand the variance in the data relative to the mean, and so Standard Deviation will come into play. Whereas some of your users may want to know what percentile a particular feature is relative to other features in the dataset. Determining which statistics to include for your users will take some careful consideration.
Feature Info Widget: Multiple Sources
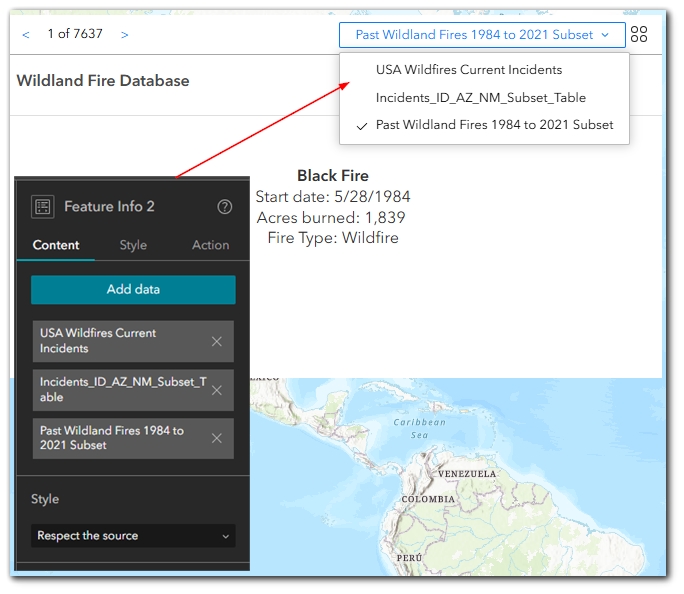
The feature info widget has long been one of our favorites because it allows our users to view pop-up information for a feature in the map without having to mess around with an actual pop-up appearing over the map features. When using the feature info widget, you as the creator can place the feature info frame outside of the map and configure it to show your users important details about selected features.
One of the downfalls of this widget has always been that only one source layer could be configured to a single Feature Info widget. With the most recent updates, we can now configure multiple layers to a single Feature Info widget, which ultimately helps us to create more powerful map applications for our users.
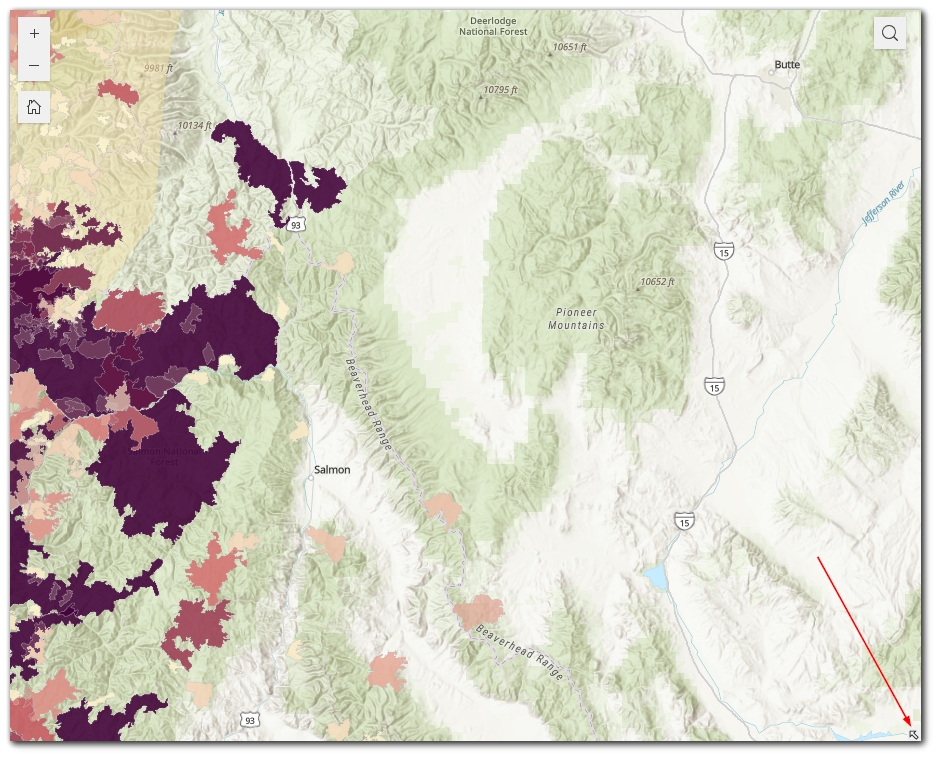
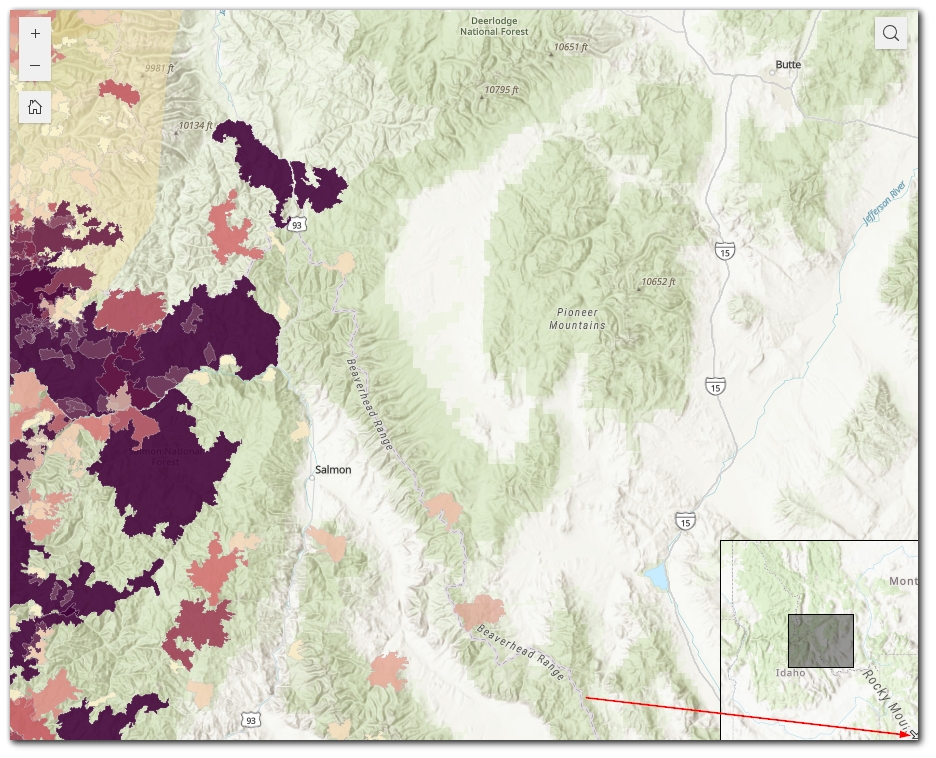
Map Overview
Inset maps are incredibly useful. Many map extents don’t provide enough information to help us understand our exact location relative to the larger landscapes that we know and understand. Now, we can enable a map overview, or inset, within the map widget. This inset is just the start to what we hope becomes an even more customizable approach to inset maps. For now, it’s a simple inset map that you, as the creator, will enable from the Map widget options. Once enabled, it is well-hidden for your users, so it may take some training to help them recognize it. You can see a very tiny arrow in the lower right-hand corner of the first image below. When a user clicks on this arrow, the inset map will appear, which you can see in the second image below.
Summary
Our hand-picked items above are just the tip of the 2024 iceberg of Experience Builder updates. But we find these to be some of the most useful because they can be included in almost any map application, regardless of the topic. If you would like to learn more about working in Experience Builder, view our full schedule of upcoming live and online Experience Builder courses: All Training Events
