

Learn more about our Intro to Experience Builder course and upcoming training schedule.
It is perhaps true that Experience Builder’s data panel is off snoring in a corner somewhere. It is likely taking a nap until the next time you need to pull it up, which, let’s face it, is few and far between. Nonetheless, the data panel provides some of the most important information to help you understand and maintain your map applications.
In this tutorial, you will learn how to navigate the data panel and why the data panel can be thought of as meta data for the underlying structure of your application. The information you can find in the panel will show you what datasets are being used in the application, which widgets your data are connected to, and within those connections, what fields are being used. This will help streamline updates and maintenance done to the application into the future, regardless of who created it.
Where can I find the data panel?
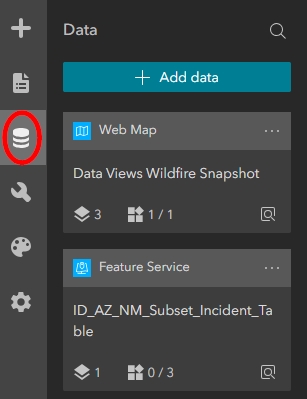
You can open the data panel by clicking on the Data Panel icon from the sidebar on the left.
What will I see in the data Home panel?
The data Home panel is where you can see the complete list of all your data connections. A data connection can be a hosted table, web map, hosted feature class, etc. You can add data connections from the panel, or, more commonly, from individual widgets as you configure them. When you add a data connection directly to your widget, it will automatically be listed as an item in your data panel.
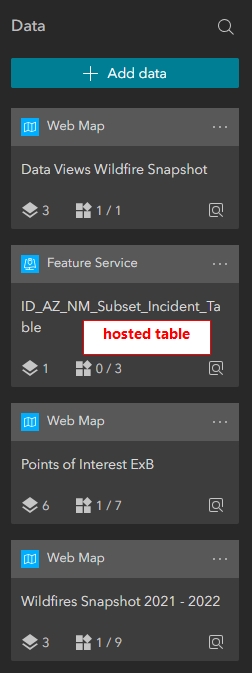
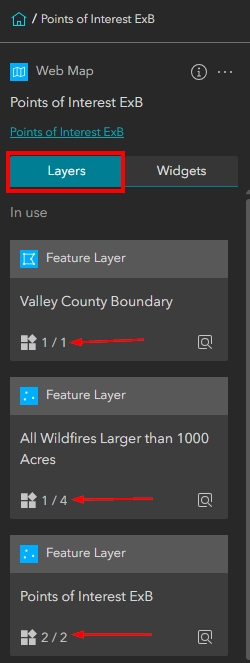
In the screenshot below, you will see three Web Maps and one Feature Service listed. In this instance, the Feature Service is actually a hosted table, but the underlying source for individual items hosted in ArcGIS Online is a Feature Service by definition, as it is hosted on ESRI’s Cloud-based Feature Server.
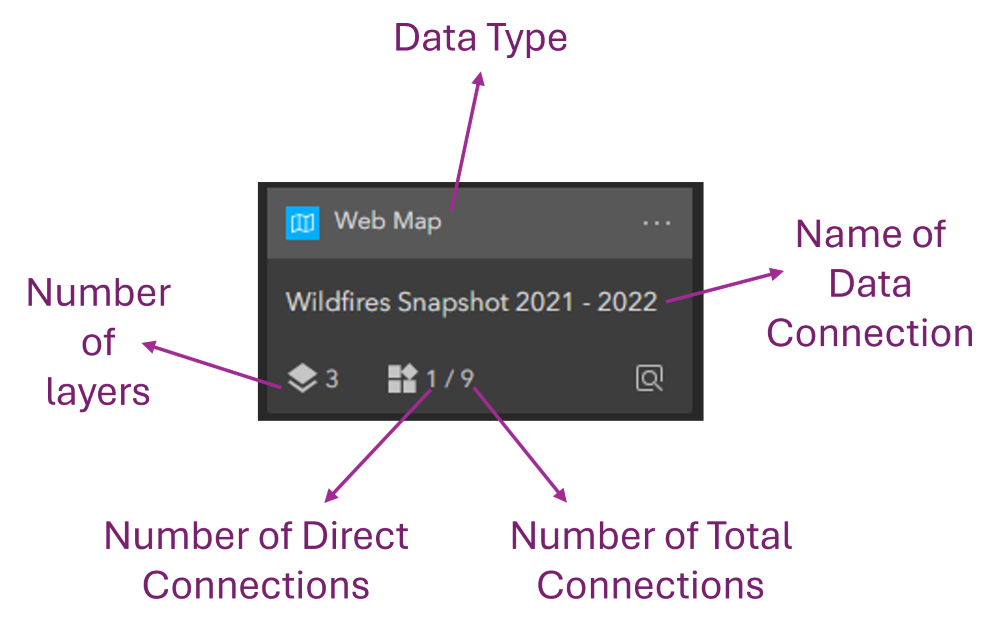
Each data connection from the Home panel shows you the following:
- Type of data
- Name of the data connection
- How many layers exist within the data item
- How many direct widget connections exist for that data
- How many total widget connections exist for that data
How can I see what layers are included with my data item?
To see what layers are included with your data item, you can simply click on the layer icon from the Home panel. Once you do, you will be taken to that data item’s Layers list.
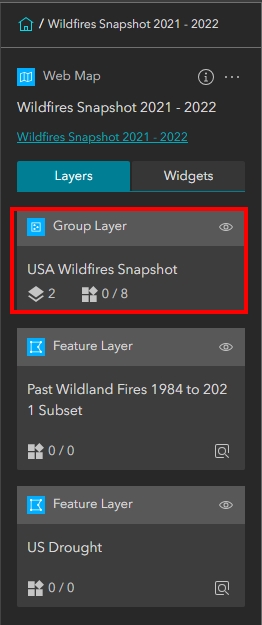
It is important to note that the Home panel will count a group layer as a single layer when it reports the number. As you can see in the first screenshot below, the Home panel is reporting this web map as having 3 layers, but when I click on the layers icon you can see one group layer that includes two layers (see second image below). This means my web map actually contains four total layers:
- USA Wildfires Snapshot is a Group Layer with 2 total layers
- Past Wildland Fires 1984 to 2021 Subset is a single layer
- US Drought is a single layer
![]()
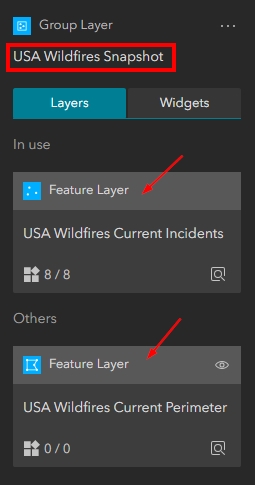
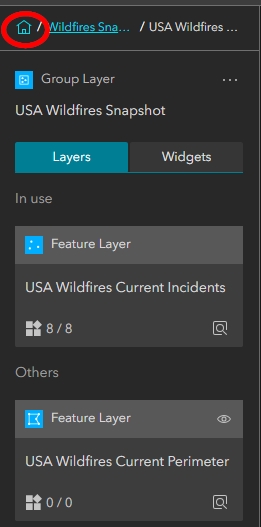
If you want to see the layer names and information associated with the Group Layer, you must again click on the layer icon to be taken to that Group Layer’s layer list. See both screenshots below. In the second screenshot, you can see the layers in the layers tab have been separated into “In use” and “Others”. Layers found in the “Others” category are not being utilized in the application.
![]()
To return to the Home panel of your data panel, simply click on the HOME icon located in the upper left of the data panel.
How can I see what widgets my data are connected to?
There are a couple different ways to get to the Widgets tab of your data item.
Option 1: You might have already noticed in the above images that there was a Widgets tab found to the right of the Layers tab we were reviewing. You can simply click into the Widgets tab from the Layers tab.
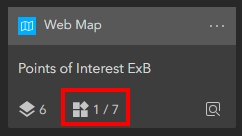
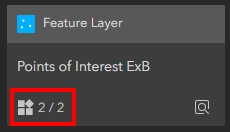
Option 2: From the Home panel, you can click on the Related Widgets Infographic. This is the infographic that tells you the number of Direct- and Total- Connections for your data item.
In the image below, the Related Widget Infographic is outlined in red. The web map in the image has one direct connection and seven total connections. A Direct Connection for the web map means that, in its entirety, it is connected to one widget. In most cases this is going to be the Map Widget. The infographic is also telling us that the web map has seven total connections. This means various layers from the web map are being used individually with other widgets.
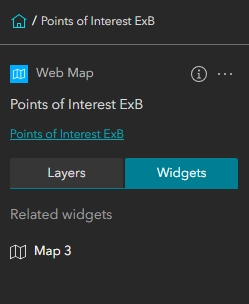
Unfortunately, when we click on this infographic to view the Widgets tab for the data, it only lists the one widget that is related to the Direct Connection. In the below image, you can see the name of the Map widget the being used is ‘Map 3’.
How can you see the other six connections represented by the seven total connections? To see this information, you must first click back to the layers tab and review the Related Widgets Infographic for each layer in the web map.
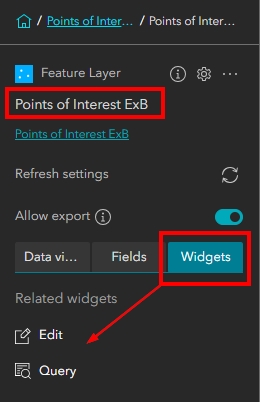
Once you are at the layers list, you can click on each of the Related Widgets Infographics to review the Widgets tab for each layer. In the example below, you can see the Points of Interest ExB feature layer is being used with the Edit and Query widgets.
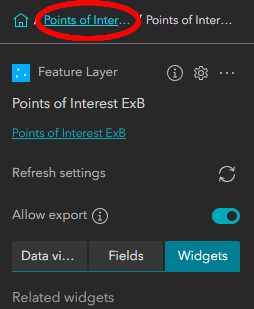
To return to the layers list, simply click on the link to the right of the Home icon in the upper left of the data panel.
How can I see what fields are being used?
Understanding what fields are being used from your data sources might be one of the most important pieces of information that you can review. As GIS Professionals, we try to not update categorical text or code values from choice domains, and we try not to alter our schema over time. But we should also understand that these types of updates are sometimes necessary. In these instances, it will be important for you to understand how this might impact the configuration of widgets within your application. So, how can you see which fields are being used?
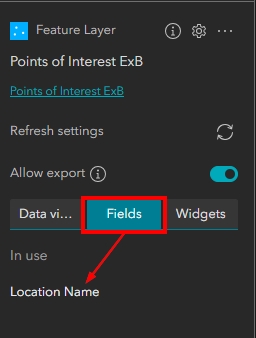
In the images directly above, you can see there is a Fields tab that exists to the left of the Widgets tab. To view the list of fields being used, you can simply click over to the Fields tab. In the example below, you can see the only field being used from this data source is the Location Name field.
How can I see what Data views exist for my data connections?
The last point we will cover are Data Views. Data views created in Experience Builder can only be used within Experience Builder. When a data view is created, it becomes an option for you to use within your widget configurations.
For example, if you have a feature layer that contains wildfire data from 1984 to 2023, but you only need to show the last 10 years of data, you can create a data view in Experience Builder that contains only data from the last 10 years. In addition, you can sort the data view by any field you wish. This means your data view of wildfires over the last decade could be sorted from largest to smallest so when it appears in tables or lists, the largest fires will always be listed at the top.
In the image below, you can see there is a Data views tab that exists to the left of the Fields tab. To see a list of the Data views that exist for your data item, click into this tab.
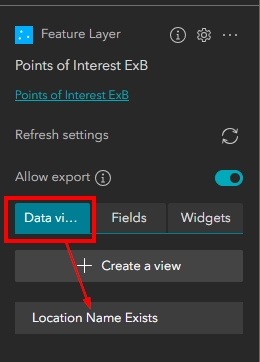
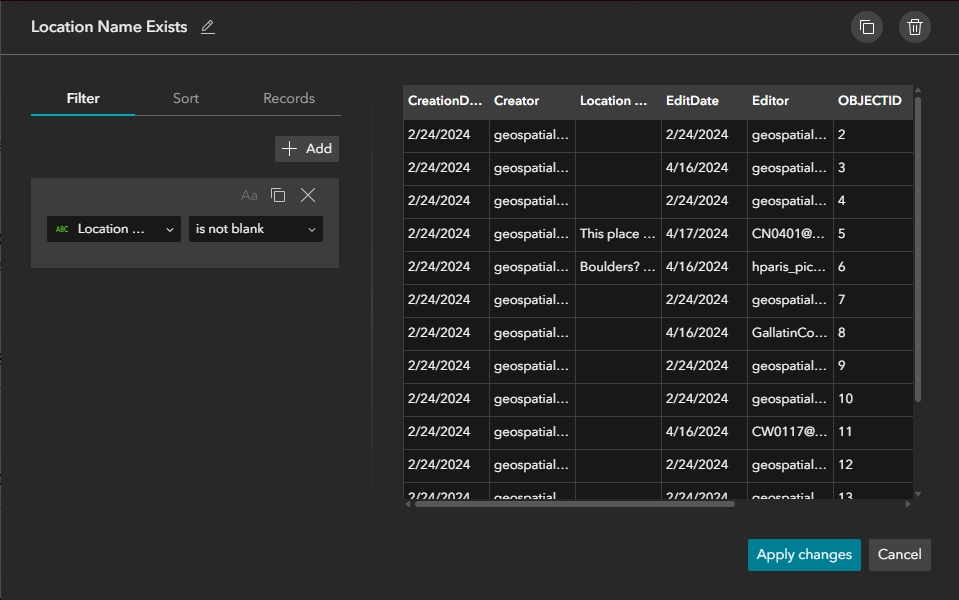
In the example above, you can see one data view has been created for the Points of Interest ExB data item called “Location Name Exists”. When we reviewed the lists for Fields and Widgets, that was as far as we could go. We could not click on a Field or Widget to see further details. For Data views, however, we can click on the Data view to review or modify its settings.
Summary
Though seemingly unimportant as you begin to configure your applications, the Data Panel will quickly become your most important resource once you understand how to navigate and find key information about the underlying structure of your applications. This is especially important when working on applications you created long ago, or applications that were created by another employee.
