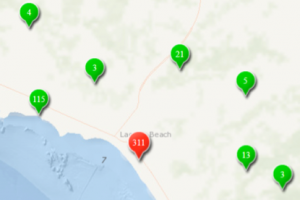
I recently had a fun question from a student on the Building Custom ArcGIS Server Applications with JavaScript class. He has a busy map service with in excess of 50,000 points on it, and was after some advice as to how to improve performance in a web application he has built to consume that service.
Sure, 50,000 points is a lot of data. But we’ve seen worse and thankfully there are a number of features in the ArcGIS Server API for JavaScript we can take advantage of to keep our users happy when interacting with large data sets like these.
How regularly is the data likely to change?
If hardly at all, consider creating a cached map service from all your points. You won’t be able to send the feature geometries and their associated attributes down to the browser for immediate responsiveness like you could with a Feature Layer, but users can still interact with your data via a QueryTask, although each interaction with a feature will require a server round trip to work.
See: Creating a Cached Map Service in ArcGIS Server
What if you need that level of interaction?
If interactivity is likely to require a lot of round trips, but users are likely to want to focus on discrete geographical areas when using your application, consider using a Feature Layer, and setting its mode to “on demand” so that points are only brought down to the client when the user requires them. Conversely, if users are likely to want to work on large areas with most of the points for a decent period of time, it might be better to use “snapshot” mode and take the initial hit of downloading all the data when the application loads. Experiment to see what works best.
See here for a demo of on demand retrieval.
Consider clustering your point data
Clustering involves “lumping together” points at smaller map scales, so you don’t display the invidual points, just a single marker with a label that denotes the number of points that marker actually represents.
Esri has a really nice sample that shows you how to do this using the Class Breaks Renderer on the Resources Center:
Do you need to see ALL points at ALL scales?
If you can get away with only showing certain features at certain scales, use scale-dependent rendering. Features can be hidden or displayed only at certain scale levels.
So you can see that with a bit of creative use of the API, even layers with gazillions of point features can prevent us from using them in our web applications!


