
Open Source Programming Courses
Visualize US Census Data in R with tidycensus and mapgl
Analysts interested in using R for data acquisition, analysis, and interactive visualization.
Students must have R, Mapbox GL JS (through R), and MapLibre GL JS (through R).
- Mapping Census data in R
- Census visualization workflows
This 2.5 hour workshop will teach you all about how to acquire demographic data from the US Census Bureau and make stunning cartographic visualizations of your Census data with the brand-new mapgl R package.
In the first part of the workshop, you’ll learn how to use the tidycensus R package for acquiring and analyzing US Census data on topics like income, race / ethnicity, home values, and much more. We’ll then walk through how to create a wide range of interactive maps of US Census data such as choropleth, graduated symbol, and dot-density maps using the powerful Mapbox and MapLibre libraries available in the mapgl package.
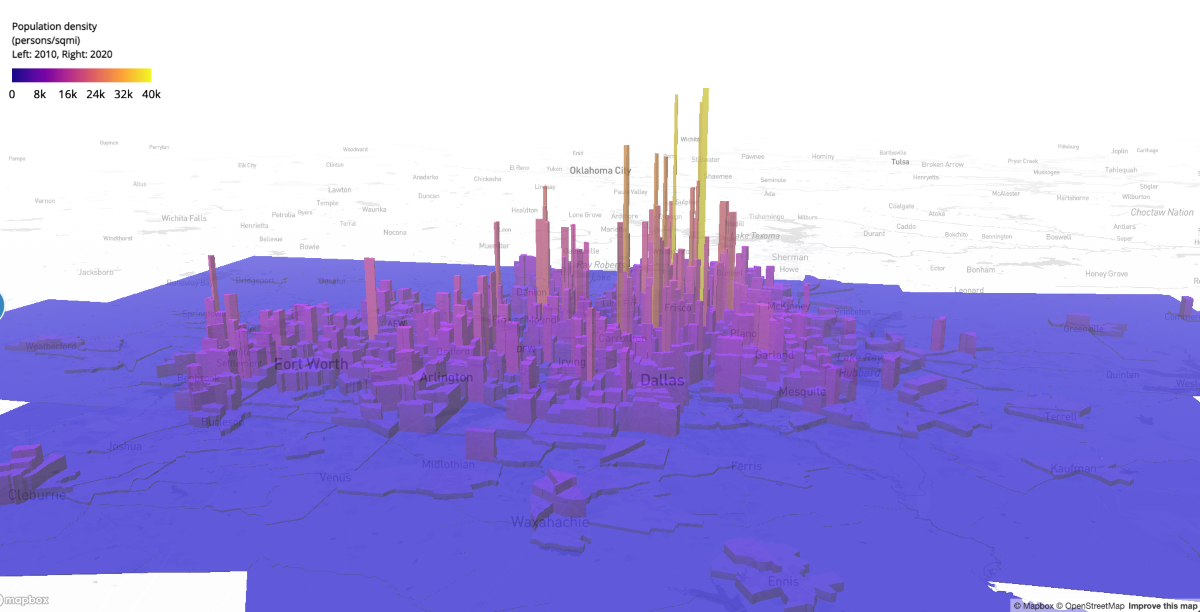
In the second part, we’ll cover how to solve common problems that arise when visualizing US Census data. This will include visualizing change over time in three dimensions; how to shift and rescale Alaska, Hawaii, and Puerto Rico on an interactive map; and best practices for performant large-scale demographic mapping, such as Census tracts across the United States!
The last part of the workshop was a live question-and-answer session where participants asked a range of mapping questions and got a live demo of some new features in mapgl.
What you’ll get:
- Unlimited access to the workshop recording and chat log for future use.
- A step-by-step annotated tutorial in Quarto format to help you build your knowledge.
None at this time.
None at this time.
Don’t want to purchase online? You can also register for classes using our registration form.
This course made it less intimidating to switch from ArcMap to ArcGIS Pro. So glad I attended.
Student, Idaho State Tax Commission
Knowledgeable instructor, well paced class, applicable information covered, hands-on style.
Brandon Clark, Alabama Power
I strongly and highly recommend it
Matt Gubitosa, U.S. EPA
I really enjoyed the Python/ArcGIS course. For me the right balance between detail and overview. Good work!
Pal Herman Sund
I thought the course was very organized. The style of presentation and the lesson format worked well together. It made the information easy to understand. -
Kyle Lockhart, Escambia County, FL
Class was well organized, well paced and I learned a lot.
Aleeta Zeller, Chattanooga RPA
Definitely got me "over the hump" of being able to grasp Python.
Joseph Monti
These courses are great. I am so pressed for time this is the only way I can acquire extra skills these days. Thank you Eric for all your hard work!
Chris Hickin, NYC Fire Dept.
I have attended a number of instructor-led training courses offered by ESRI, which are great in their own right, but the Mastering the ArcGIS Server JavaScript API course gets much more in-depth than they often do. I really liked the recommended reading, they helped expand the terms being covered in lecture to concrete examples that could be related back to my work more directly instead of just having the lecture and exercises alone. I learned a lot andwill recommend this and other GeoSpatial Training courses to the GIS'ers I know. Thanks for putting this course together and offering it.
Jason Warzinik, Boone County, MO
Really good course material. Very relevant subject matter.
Michael Philp, City of Springville, UT
Very informative and knowledgeable course. It help determine which direction I should take my further GIS and web programming skills.
Chris Pollard, Delaware Valley Regional Planning Commission