

In the third installment of our series on analyzing wildfire activity using spatial analytics we’re going to examine the spatial distribution of human induced and naturally occurring wildfires throughout the United States. In the first two parts of this series we downloaded our dataset from a USGS map service, cleaned up our dataset, and did some initial hot spot and cluster and outlier analysis. If you want to follow along with the exercises in this article you’ll want to read the two articles linked above.
Human Induced Wildfire Hot Spots
In this section we’ll dive a little deeper into the data and examine the distribution of human caused wildfires.
- The HistoricalWildfiresPrj feature class includes a firecause attribute field with a single character to indicate the cause of the fire. A value of ‘H’ indicates a human caused wildfire. Use the Select by Attributes tool to select these features. The selection set includes 12,307 human caused wildfires.
- Export the selected set to a feature class called HumanCausedWildfires in the USGS Wildfire Data geodatabase.
- Spatially join the HumanCausedWildfires feature class to the USCounties_Lower48Prj feature class to create a new feature class called USCountiesJoined_HumanCaused.
- This will create a Count_ field in the USCountiesJoined_HumanCaused feature class. There will be some Null values that you’ll need to recalculate to 0.
- This value needs to be normalized by the population in each county. Create a new field called NormCount as a double data type and populate it by dividing Count_ by the Population field (the Population field is an alias for the POP2015 field.
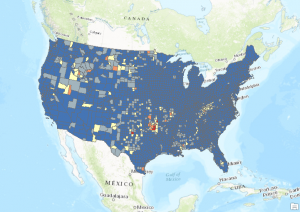
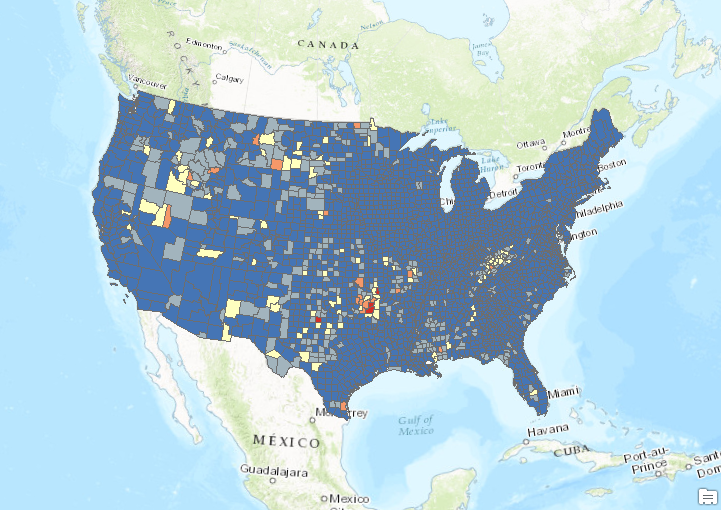
- Create a color coded map using the NormCount and you should see a map similar to that shown in the screenshot below. What does this map reveal? Not a whole lot, but it does hint at the possibility that human caused wildfires are perhaps higher in Oklahoma, Montana, and Idaho. Let’s run the Hot Spot Analysis tool to see if the patterns are more apparent.
- Run the Hot Spot Analysis tool using the USCountiesJoined_HumanCaused feature class as the input feature class, NormCount as the input field, and Zone Of Indifference as the Conceptualization of Spatial Relationships parameter. Use a distance of 192817 for the Distance Band parameter. You can see the input parameters in the screenshot below.
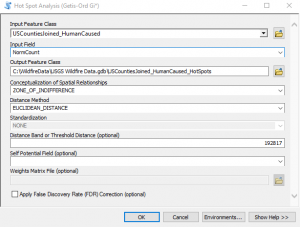
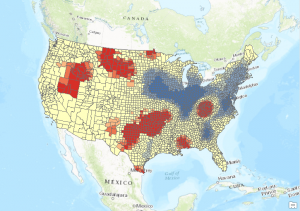
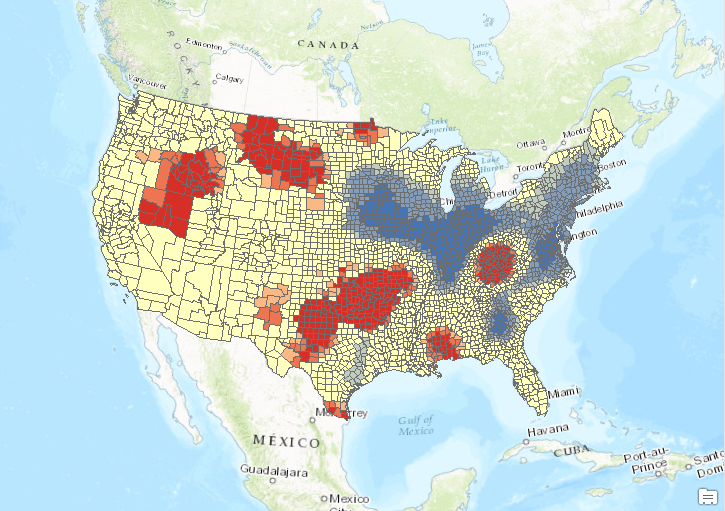
- Click OK to execute the tool. The output should appear as seen in the screenshot below. Some clear patterns of hot spots for human caused wildfire are now evident. In some cases the hot spots for human caused wildfire activity are similar to the results we found when analyzing the entire dataset regardless of cause. These include the Appalachian region, the Gulf Coast (not including Florida), Oklahoma, and Idaho. However, some new patterns have appeared including hot spots in the upper plains region (Montana, Dakotas), lower plains (Texas and eastern New Mexico).
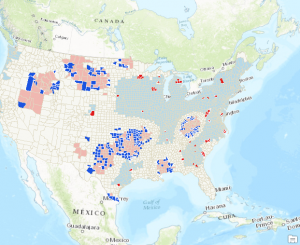
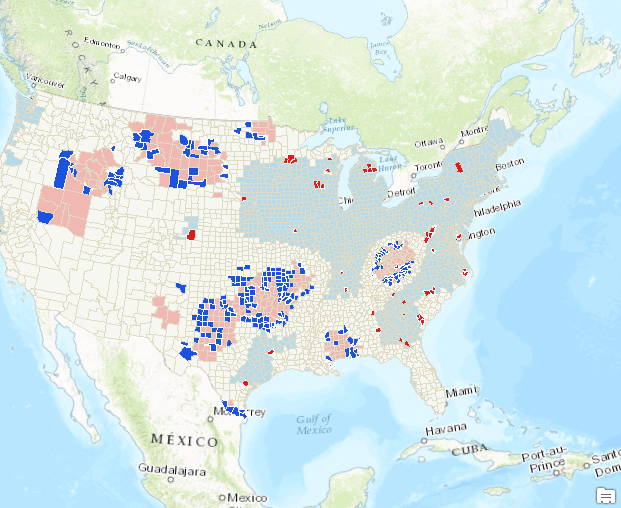
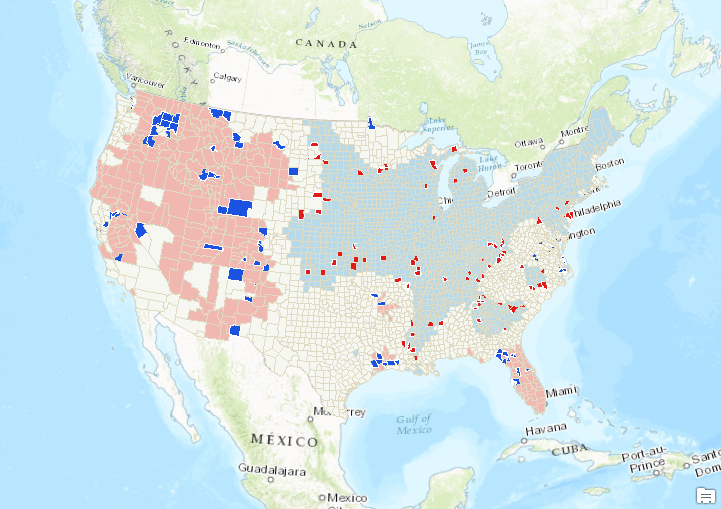
- Run the Cluster and Outlier Analysis tool using the same parameters to create the output seen in the screenshot below.

Naturally Caused Wildfire Hot Spots
- Use the Select by Attributes tool to select features from the HistoricalWildfiresPrj feature class where the firecause attribute is ‘L‘ (lightning) or ‘N‘ (natural). This should select 8619 features.
- Export the selected set to a feature class called NaturallyCausedWildfires in the USGS Wildfire Data geodatabase.
- Spatially join the NaturallyCausedWildfires feature class to the USCounties_Lower48Prj feature class to create a new feature class called USCountiesJoined_NaturallyCaused.
- This will create a Count_ field in the USCountiesJoined_NaturallyCaused feature class. There will be some Null values that you’ll need to recalculate to 0.
- This value needs to be normalized by the size of each county. Create a new field called NormCount as a double data type and populate it by dividing Count_ by the SQMI field.
- Run the Hot Spot Analysis tool using the USCountiesJoined_NaturallyCaused feature class as the input feature class, NormCount as the input field, and Zone Of Indifference as the Conceptualization of Spatial Relationships parameter. Use a distance of 192817 for the Distance Band parameter. The output should appear as seen in the screenshot below.
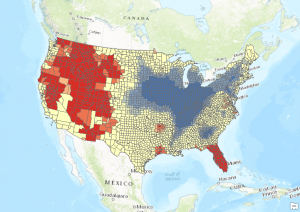
- Run the Cluster and Outlier Analysis tool using the same parameters to create the output seen in the screenshot below.

Conclusion
When examining the hot spot maps for both human and natural causation there are some clear differences in the clustering of wildfire hot spots across the United States. Naturally caused wildfires have a distinctive hot spot clustering throughout the western United States and Florida, while human caused wildfires are more widespread but with distinctive clusters in the Appalachian region, southern areas of the Great Plains (Oklahoma, Texas, and Missouri), northern areas of the Great Plains (Montana, North Dakota, South Dakota), as well as southern Idaho and northern Nevada. In the next article we’ll perform some additional analysis by including time into the analysis.
More information on Spatial Analytics:
- Need help with a spatial analytics, data science, or data visualization project? Get more information on our consulting services.
- Class – Introduction to Spatial Statistics using ArcGIS and R
- Class – Python for Data Science I: Python programming and efficient data management (Pandas)
- Class – R for Data Science I: R Programming and Efficient Data Management
- Book – Spatial Analytics in ArcGIS
- Services – Spatial Statistics and Data Science
