Our last post introduced you to Google Fusion Tables, and today we’ll take it one step further and actually upload some data to Google Fusion Tables and create some basic maps. In this post you’ll learn how to import your data to Google Fusion Tables and explore several ways that you can create maps from the data.
What Data Can You Use?
Let’s start with some basic concepts such as the types of data files that you can import along with the procedures for doing so. Data imported into Fusion Tables will be structured in a tabular format. There are a number of file formats that can be imported into Fusion Tables including comma separated text (.csv), other delimited text file formats such as tab delimited files, Google Spreadsheets, and KML files. With these formats you can upload up to 100 MB of data for any one table with a maximum quote of 250 MB per user. You may also import spreadsheet files such .xls, .xlsx, and .ods.
Creating a Fusion Table
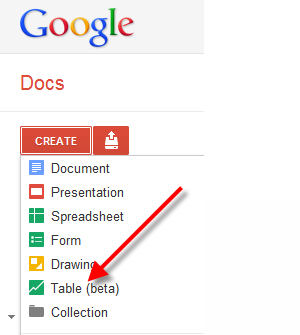
Before you can import data to Fusion Tables you will first need to create a Google Account if you don’t already have one. Once you’ve created your Google Account you will then need to go to Google Docs and click the ‘Create’ button and then select ‘Table’.
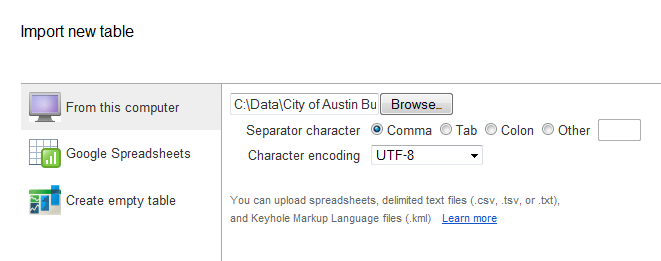
Next, click the Browse button and choose the file to upload from your computer and press Next. In the figure below I have selected a .csv file containing building permits for the City of Austin, TX.
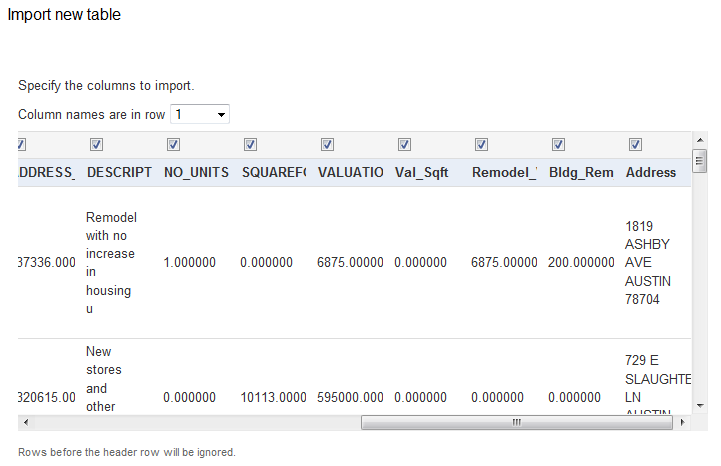
Specify the columns that you’d like to include in the final table.
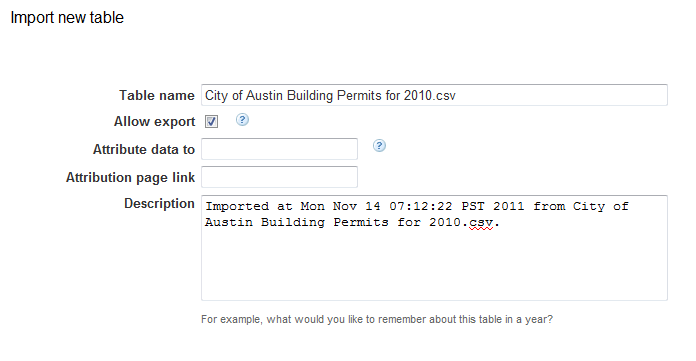
Finally, give your table a name and press Finish.
Sharing Your Table
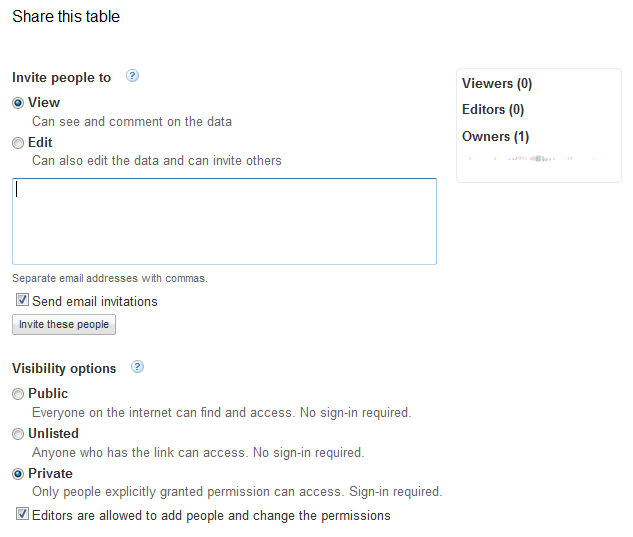
Once your table has been uploaded you can share the data with others or keep it private. By default, your table will be private, but this can be changed to Public so that everyone with access to the Internet can see the data, or it can remain unlisted if you just want to provide a link to the data. Additionally, you can invite people to Edit your data as well.
Mapping Your Data
As I mentioned earlier, Fusion Tables can upload data from multiple sources including delimited text files, spreadsheets, and KML files among others. When working with point data you will often upload either address information containing streets, city, state, and postal code or raw location information in the form of point coordinates. Fusion Tables can handle either scenario.
If you’re working with raw coordinate information the data should be stored in decimal degree format (lat, long). Address level information should be combined into a single column. For example, many spreadsheets contain address information in multiple columns where the address, city, state, and postal code are all in separate columns. If this is the case you’ll need to combine the information into a single column. If you need assistance with concatenating this information please visit the Google Fusion Tables help page for this topic.
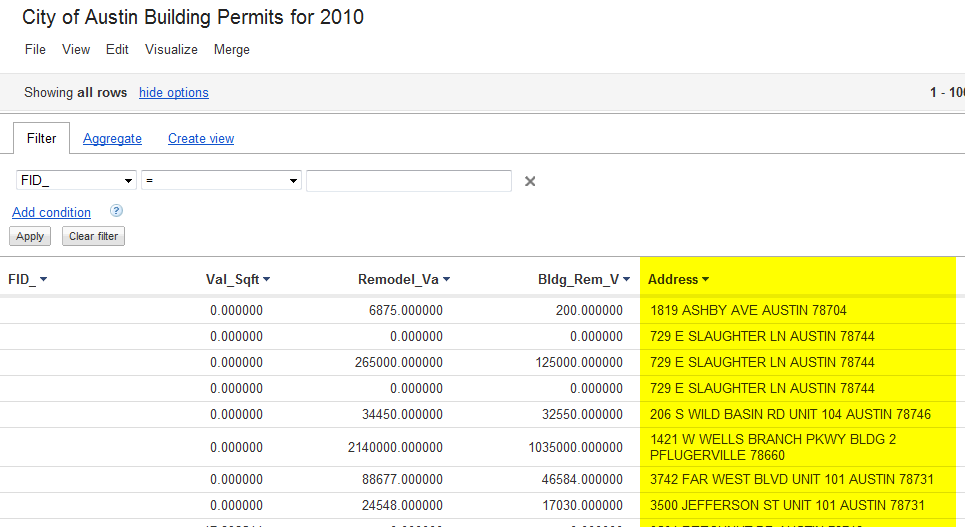
I’ve uploaded a Fusion Table called ‘City of Austin Building Permits for 2010’, and have made it public to anyone on the Internet. This table contains an ‘Address’ field which is a concatenation of the Address, City, State, and Zip columns. You can see the table and Address field in the figure below. Before the data in the Address field can be displayed on the map it will need to be geocoded and this is done automatically by Fusion Tables.
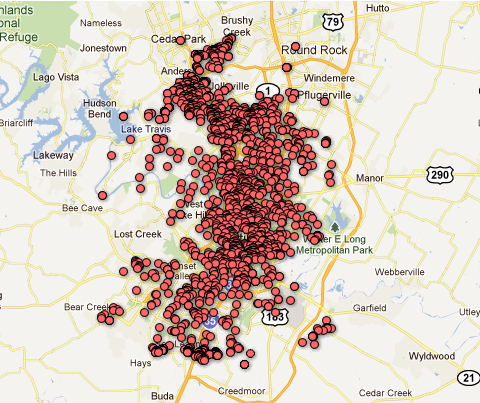
To map this data I can simply select Visualize à Map. The following map will be displayed with each row representing one building permit from the year 2010.
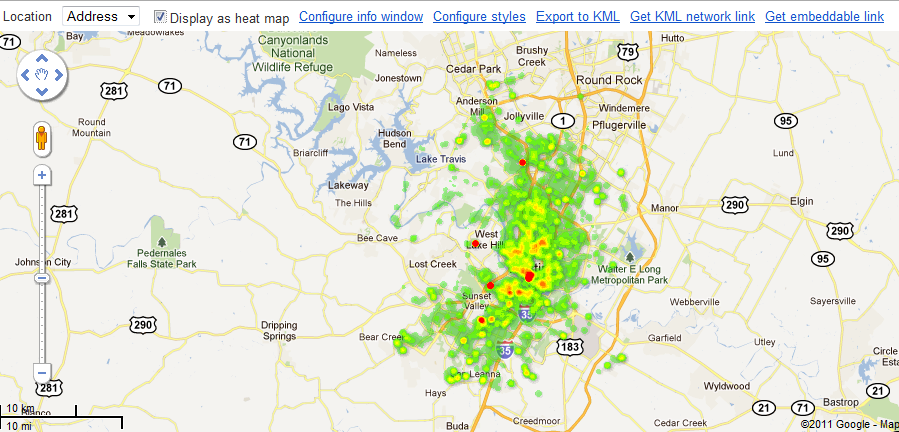
This data can also be displayed as a heat map simply by clicking the check box as seen below. Also notice that the Location is specified as the Address field from the table.
Data can also be mapped using coordinates (lat, long) instead of an address.
Styling Your Maps
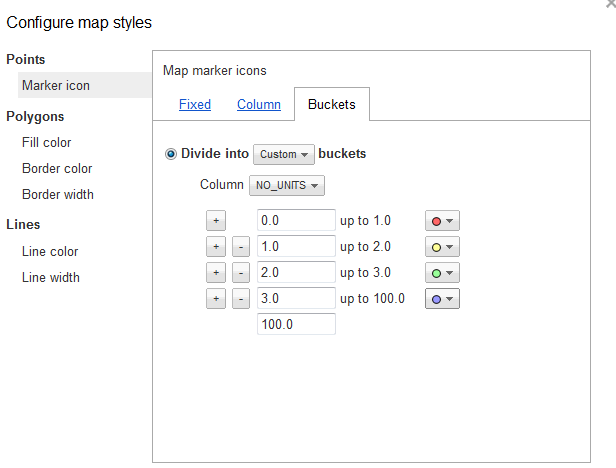
By default, when working with points, Fusion Tables will symbolize each row with a single red point as seen in the first map. However, you can style the features in your Fusion Tables by clicking the ‘Configure styles’ link just above the map. You can also group the point features through the Styles form as seen below.
Styling is not just limited to point features though. You can also style polylines and polygons that have been imported from KML files.
There are many other mapping related functions that can be performed with Fusion Tables including exporting to KML, getting KML network links, embeddable links, intensity maps, tabular merging, and more. We’ll take a look at some of these in coming posts.

