The 2017 wildfire season shattered records and cost the U.S. Forest Service an unprecedented $2 billion. From the Oregon wildfires to late season fires in Montana, and the highly unusual timing of the California fires in December, it was a busy year in the Western United States. And 2018 shows no signs of a slowdown in the frequency and size of wildfires.
While 2017 was a particularly notable wildfire season, this trend is nothing new and research suggests we can expect this unfortunate trend to continue due to climate change and other factors. A recent study suggests that over the next two decades, as many as 11 states are predicted to see the average annual area burned increase by 500 percent.
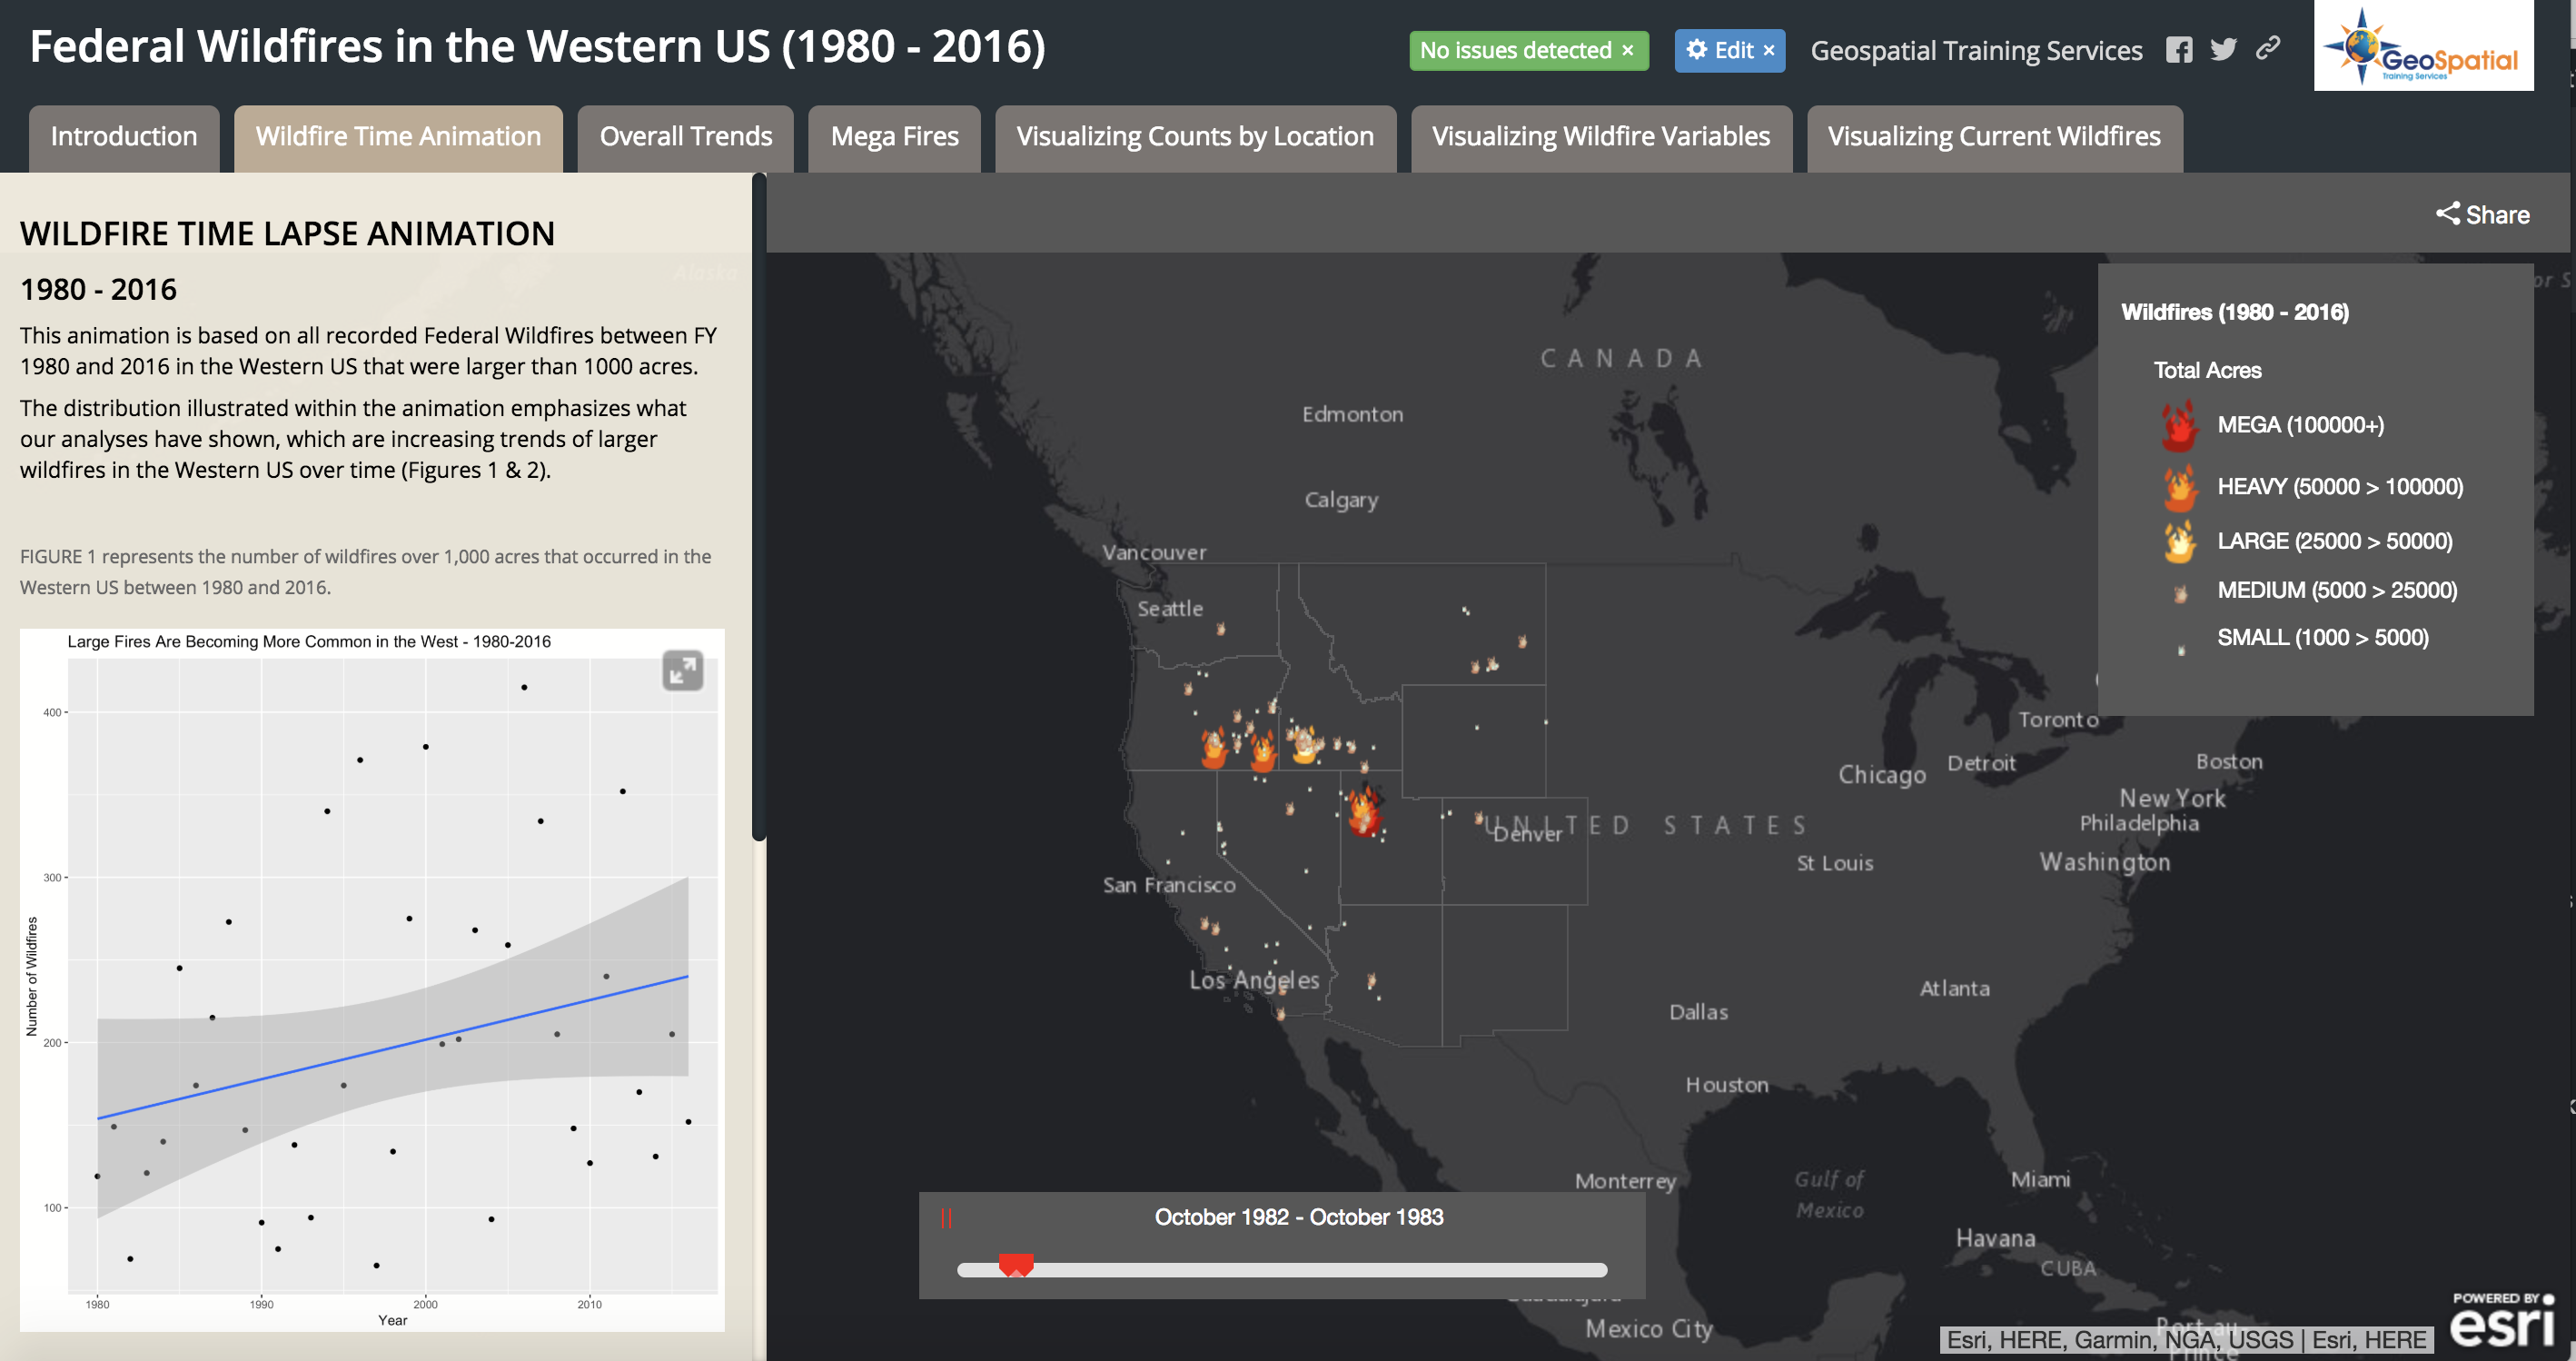
Kara Utter and Eric Pimpler from Geospatial Training Services recently built an ArcGIS Web AppBuilder/Story Maps application with an embedded R Shiny application that enables you to visualize both historical and current wildfire information in a single application. This map application allows a utilitarian and interactive approach to visualizing the past 37 years of Federal wildfire data, including:
- Time lapse animation
- A closer look at Mega Fires
- Wildfire proximity counts based on a location of interest
- Filtering map view by year, cause, size and fire organization
- Visualizing current wildfire and drought conditions across the Western US
You take a look at the application at https://arcg.is/1Tem4m
Geospatial Training Services develops user-friendly GIS web, mobile and desktop applications that make sharing, collecting and using information easier without requiring everyone to be GIS or database experts. Our developers are experienced with the latest development technologies including:
- JavaScript
- ArcGIS Server and the JavaScript API
- Dojo, jQuery, Node, Angular, Bootstrap, Backbone
- Python
- R
- .NET with ArcObjects
- Google Maps API, OpenLayers, Carto API
- HTML5 and CSS3
Contact us at [email protected] for more information on how we can assist with your custom application development project.

