

ArcGIS Pro 2.2 is a major release full of exciting new features. If you haven’t already begun migrating from ArcGIS Desktop to ArcGIS Pro now is certainly a great time to get started. ArcGIS Pro 2.2 is Esri’s 64-bit flagship desktop product. Here are some of the highlights of the release. I’m just going to highlight the main items here. Full details from Esri are available here and there is also a video overview.
While you’re here check out our ArcGIS Pro training opportunities. We will be teaching a variety of ArcGIS Pro classes around the country and we can come to your site to teach any of our classes as well.
Full Motion Video
Play and analyze video that has been geospatially enabled. Display of the video frame footprint and sensor position on the map while the video plays.
Stream Layer
Stream layers support the ability to display streaming data in real time and is ideal for dataset that change rapidly over time.
Slice Tool
The slice tool Interactively reveals content hidden behind or within other content. Use it to slice through the content in your scene using planes or volumetric shapes.
Metadata
- You can now view and import different metadata types and export metadata to XML.
- You can save a copy of an item’s ArcGIS metadata as an HTML or XML file on disk.
Mapping and Visualization
- Elevation surfaces are now listed in and managed from the Contents pane.
- You can drag datasets (for example, layer files or packages, shapefiles, images, tables, or TIN, LAS, or KML datasets) from your file system to the Contents pane of a map or scene to specify exactly where in the layer draw order you want the new layer to appear.
- You can now directly input coordinate locations and navigate using the Go To XY tool.
- To copy the coordinates of the current location to the clipboard, right-click the location and click Copy Coordinates
 .
. - You can create a point feature layer and an associated point feature class directly from tabular data.
- You can now pause the drawing of a map or scene and still interact with it. Click the Pause Drawing button
 in the lower right corner of the map or scene.
 - The Rectangle Zoom tool
 can be added to the ribbon or Quick Access Toolbar.
Symbology
- Dot density symbology has been updated with the following additional capabilities:
- Change the dot value dynamically to maintain visual density as you change scales.
- Customize the verbal expression that is shown for the layer in the legend in the Contents pane and on a layout.
- Constrain dot placement with a masking layer.Dot density symbology has been updated with the following additional capabilities:
- The Symbology pane has been reorganized with the following new tabs for ease of use:
- Primary symbology tab
 —Set the main aspects of the symbology.
 - Vary symbology by attribute tab
 —Set up multivariate symbology by symbolizing on additional fields.
 - Symbol layer drawing tab
 —Manage the way symbol elements are layered in the draw order across features.
 - Advanced symbol options tab
 —Access additional symbol settings such as feature level masking and classification sample sizes.
- Primary symbology tab
Layout
- You can clip a measured grid to only show coordinates within its UTM zone boundary.
Text
Four new tools have been added to the Annotation toolset:
- Map Server Cache Tiling Scheme To Polygons creates a new polygon feature class from an existing tiling scheme.
- Annotate Selected Features creates annotation for the selected features of a layer.
- Tiled Labels To Annotation converts labels to annotation based on a polygon index layer.
- Update Annotation Reference Scale updates the reference scale of an existing annotation feature class.
Styles
- You can download a PDF document that shows every symbol and style item included in the ArcGIS Pro system styles.
- Inferno, Magma, Plasma, and Viridis scientific color schemes are now included in the ArcGIS Colors system style. These color schemes are particularly useful with imagery, LAS symbology, unclassed, and graduated colors symbology.
Tables
- You can copy the selected rows to the clipboard and paste them into other places or applications, such as Excel.
- The table view’s menu has been expanded to include a Related Data option, so you can select from a list of available relates and display them relevant to the current layer or table selection.
Pop-Ups
- Pop-ups have an improved user experience for showing attribute information in a dockable pane. You can click a feature using the Explore tool
 or drag a box to identify multiple features. The Pop-up pane displays a list of identified features, grouped by layer, and a formatted list of field attributes. You can pin a pop-up to the screen to compare multiple pop-ups or move it back to the Pop-up pane. You can select or navigate to identified items from the results list. You can also copy the coordinates displayed for individual features. The context menu for identified features has been expanded and has more information and functionality available, such as navigating, selecting, and opening layer properties.
Analysis and Geoprocessing
- Batch processing has been added to Pro at 2.2. This allows you to automate the running of a tool multiple times using many input datasets or different parameter settings.
- Tools such as Select Layer By Attribute and Select Layer By Location can now be run using a feature class directly as input. The output of these tools is a new layer with a selection applied. This is especially useful when using these tools in ModelBuilder or Python scripting, as the tools can now be used without running Make Feature Layer prior to the selection tool.
- Geoprocessing history can be accessed in a new way from the Recent section of the Geoprocessing pane.
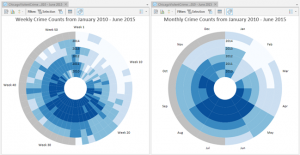
Charts
- A new chart type, Data Clock, has been added as a way to visualize data change over time. The data clock is especially useful for visualizing and discovering cyclical or season patterns in your data.
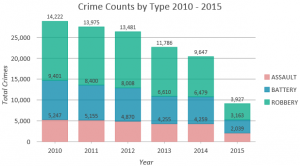
- Bar charts, line charts, and box plots can be rotated to be viewed vertically or horizontally.
- Data labels can be added to bar charts and line charts.
- Multiseries bar charts can be stacked, as well as placed side by side.
Python
- The arcpy.sharing module has been added to share web layers using Python. The sharing module supports sharing web feature layers and web tile layers to ArcGIS Enterprise or ArcGIS Online, as well as sharing map image layers to an ArcGIS Enterprise portal federated server.
- The default Python environment, arcgispro-py3, is now read-only, but new environments are created in your user profile and no longer need administrative access to be created or modified.
- Learn how to automate your ArcGIS Pro geoprocessing tasks in our new book.
New Toolbox Functionality
Many of the toolboxes in ArcGIS Pro have a significant number of new additions and changes. There are really too many changes to mention here so I’ll refer you to the full Esri release for a complete list of additions and changes that have been implemented in the geoprocessing toolbox.
Upcoming ArcGIS Pro Classes
We have a full calendar of ArcGIS Pro training classes slated for the upcoming months. Classes will be offered at locations around the country and we can also come to your location to teach as well. Contact us at [email protected] for more information.
