
The 2017 wildfire season shattered records and cost the U.S. Forest Service an unprecedented $2 billion. From the Oregon wildfires to late season fires in Montana, and the highly unusual timing of the California fires in December, it was a busy year in the Western United States. While 2017 was a particularly notable wildfire season, this trend is nothing new and research suggests we can expect this unfortunate trend to continue due to climate change and other factors. A recent study suggests that over the next two decades, as many as 11 states are predicted to see the average annual area burned increase by 500 percent.
Using the Federal Wildland Fire Occurrence Database, Geospatial Training Services recently used ArcGIS Pro and the R programming language to better visualize the change in wildfire activity from 1980 to 2016. Our analysis was limited to the Western United States including California, Arizona, New Mexico, Colorado, Utah, Nevada, Utah, Oregon, Washington, Idaho, Montana, and Wyoming. We were particularly interested in the surge of large wildland fires, categorized as fires that burn greater than 1,000 acres.
Here, in visual form, is what we found. All charts were produced with R Studio using the ggplot2 library and all maps with ArcGIS Pro. In the next few months we’ll provide some interactive visualizations on this topic created with Web App Builder/Story Maps and Shiny R Apps.
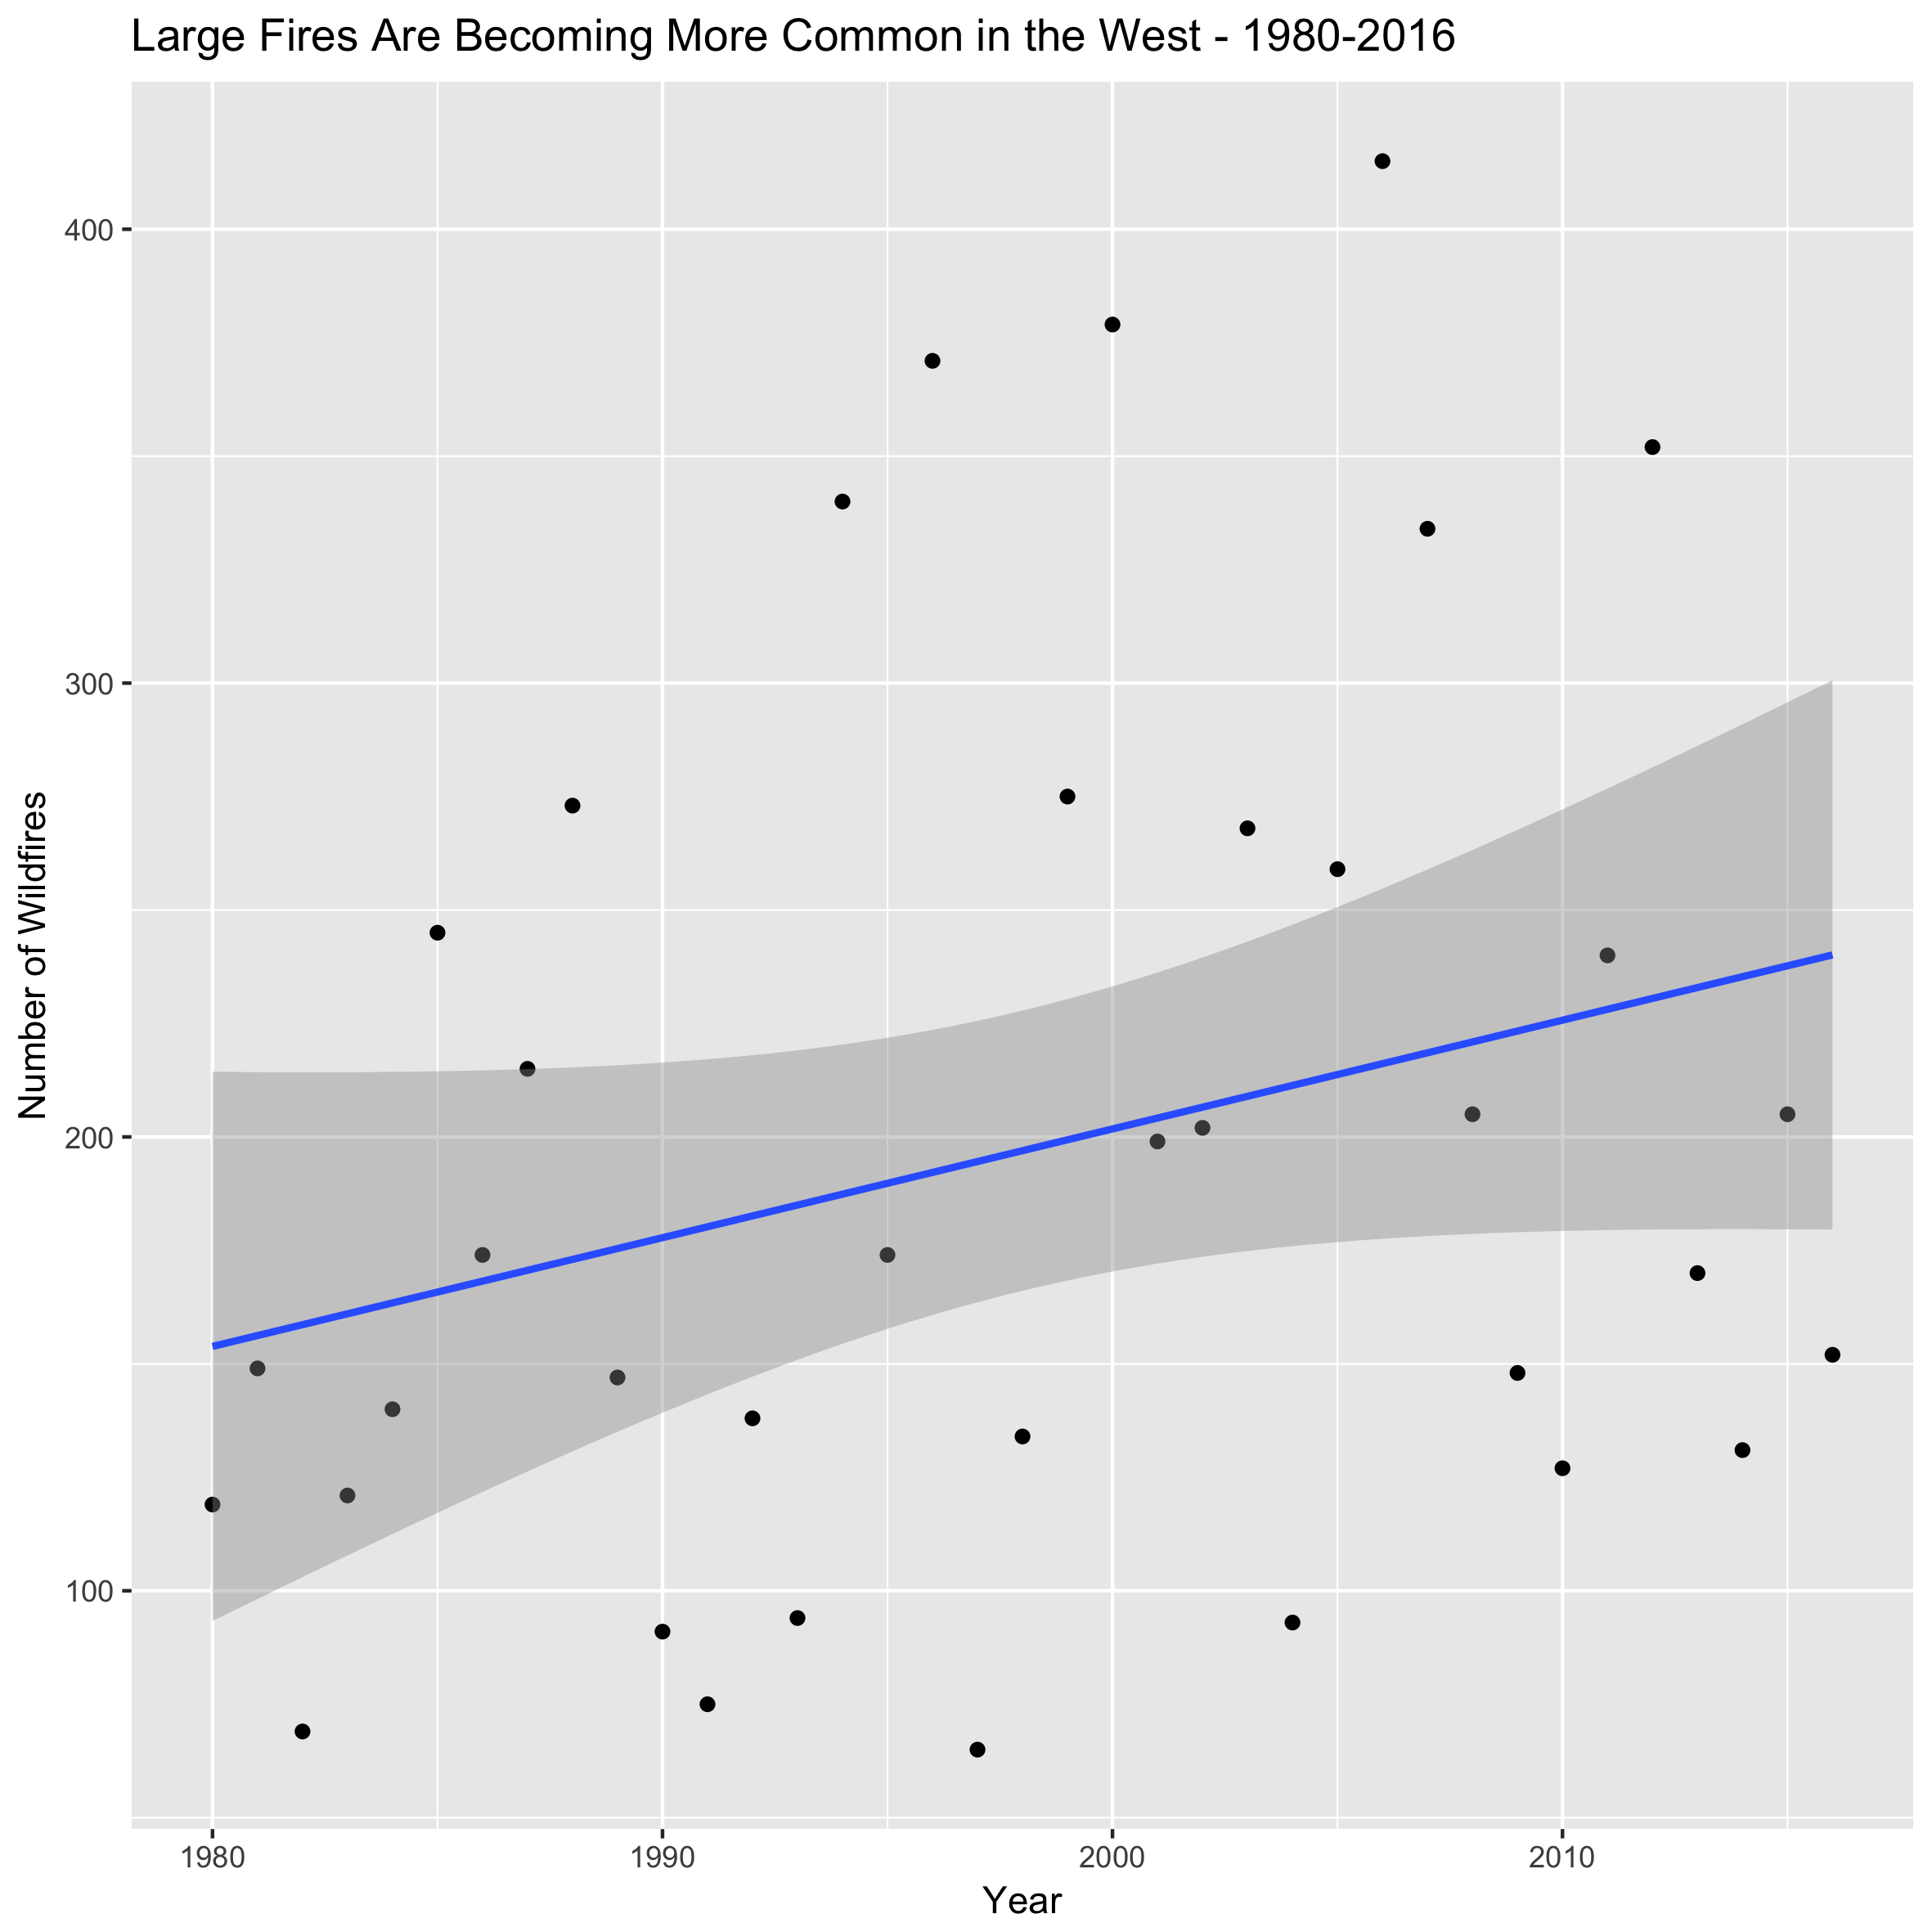
[dt_sc_h3]Wildfires Greater than 1,000 Acres[/dt_sc_h3]
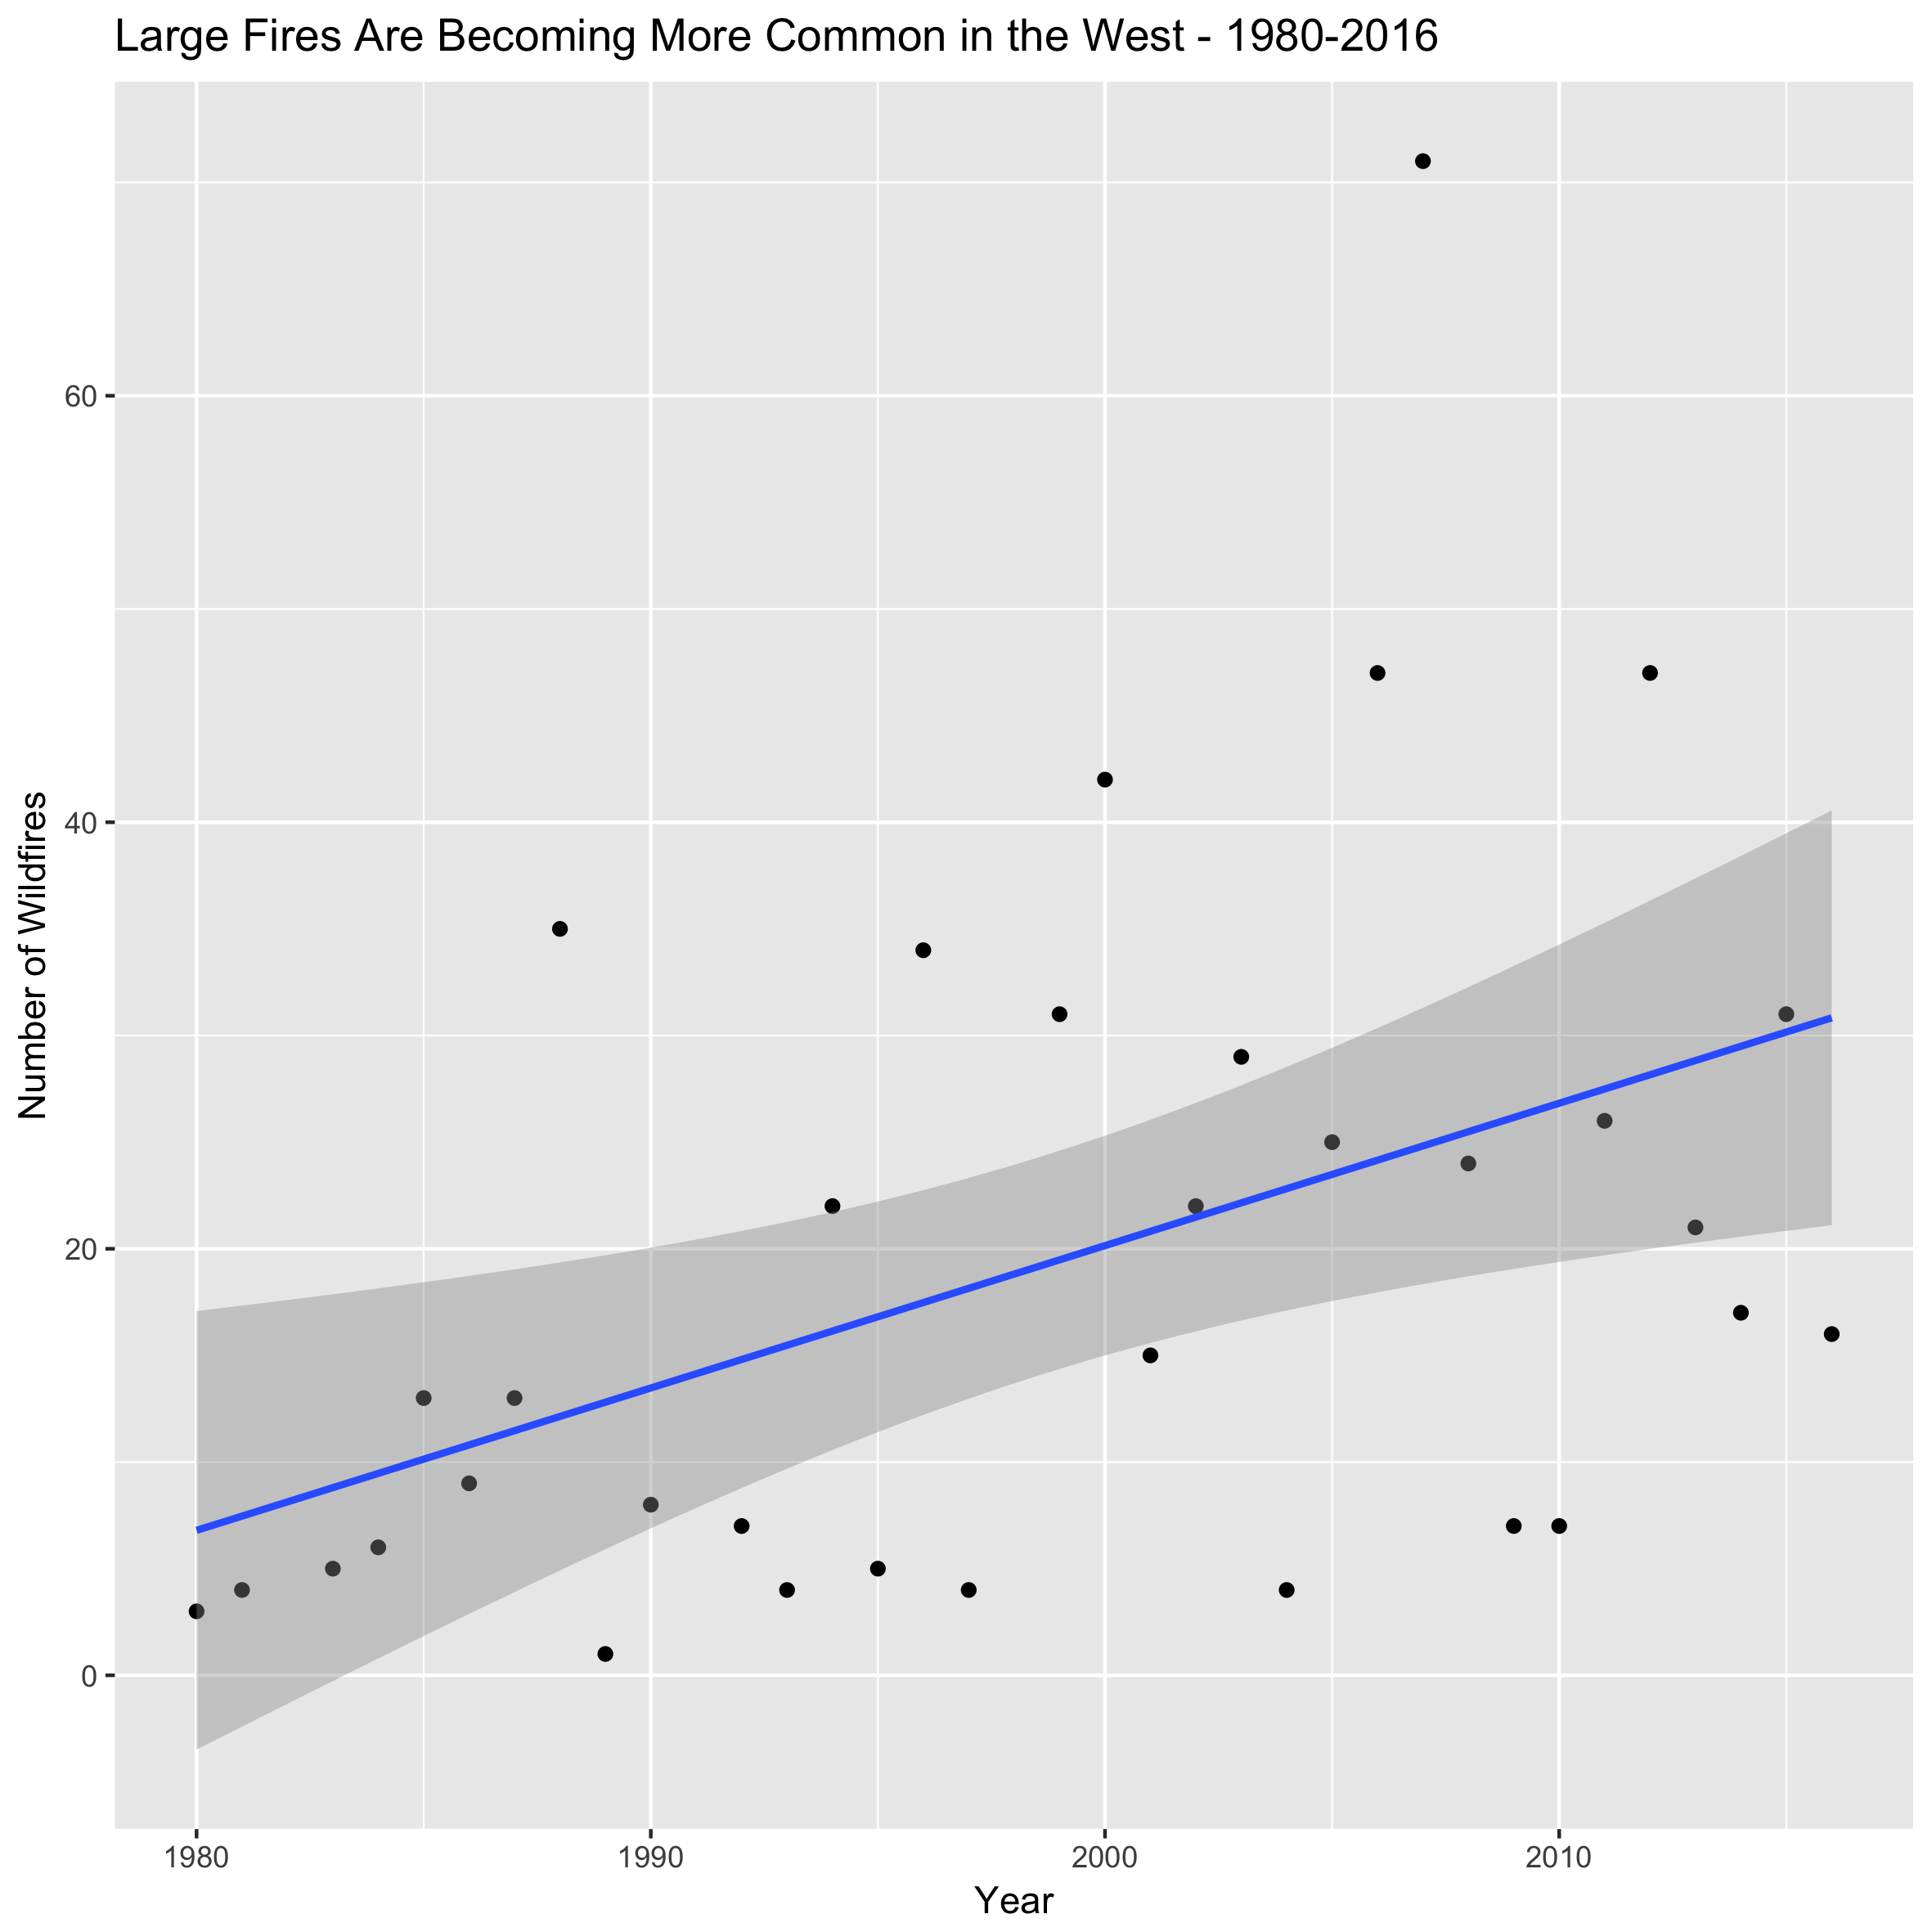
[dt_sc_h3]Wildfires Greater than 25,000 Acres[/dt_sc_h3]
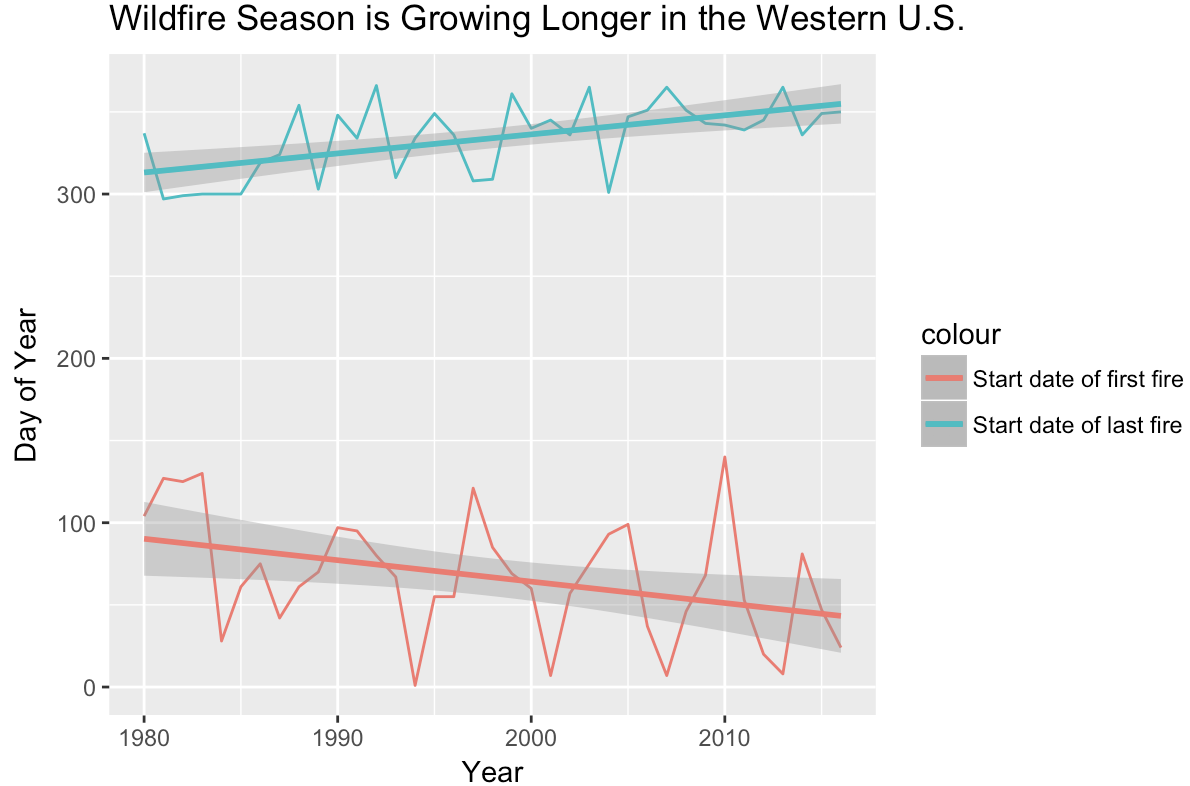
[dt_sc_h3]Length of Fire Season[/dt_sc_h3]
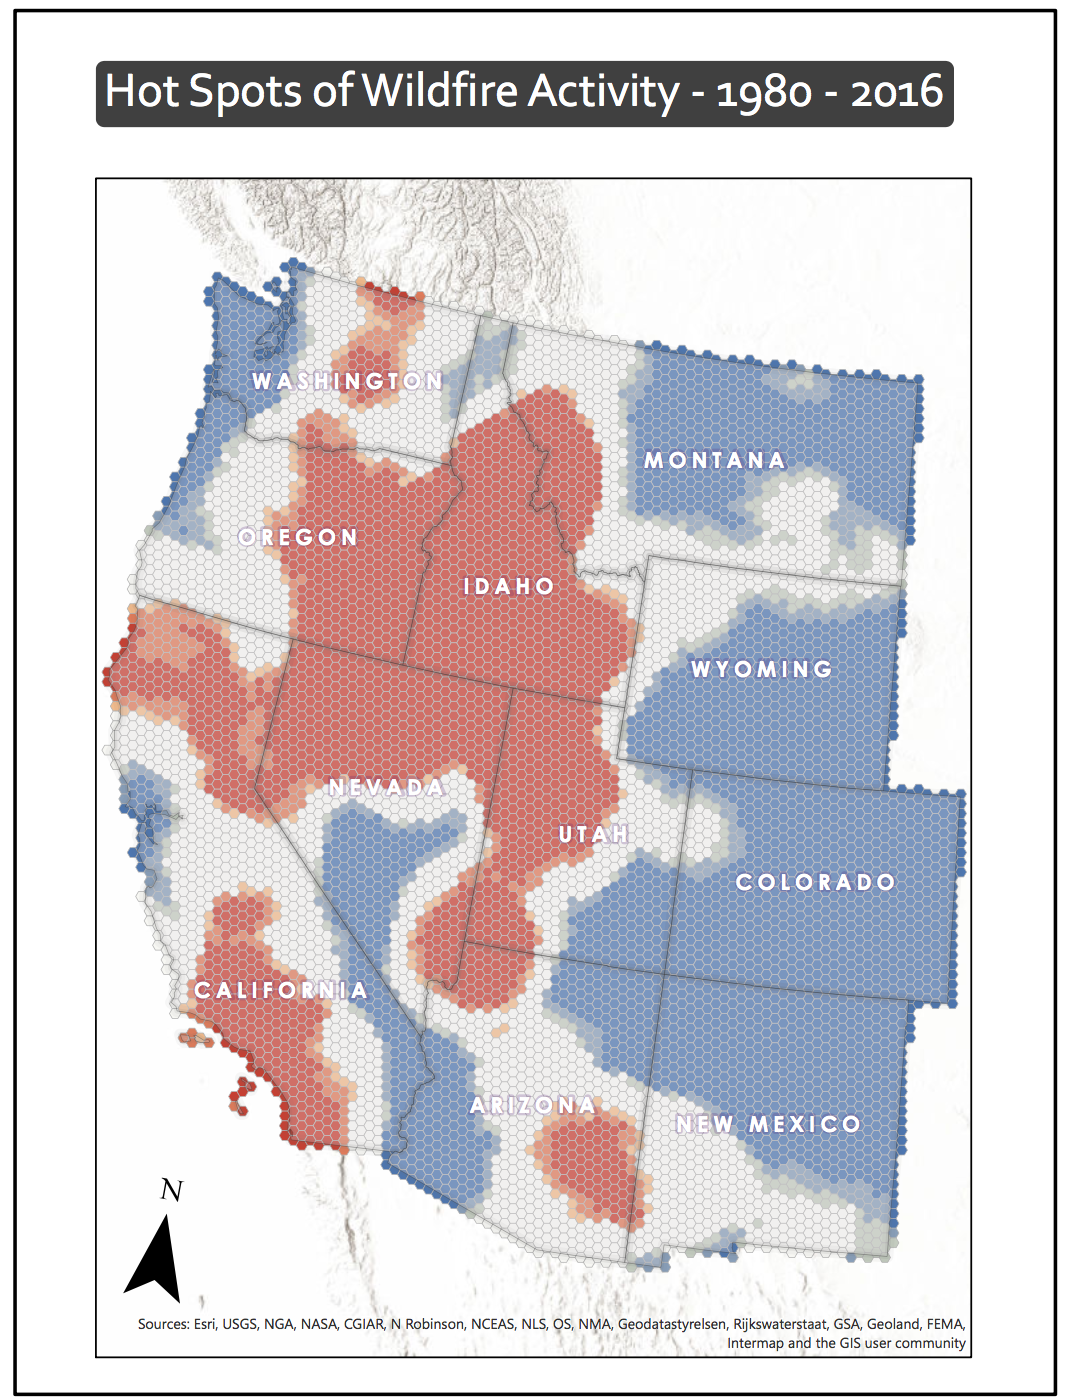
[dt_sc_h3]Statistically Significant Hot Spots[/dt_sc_h3]
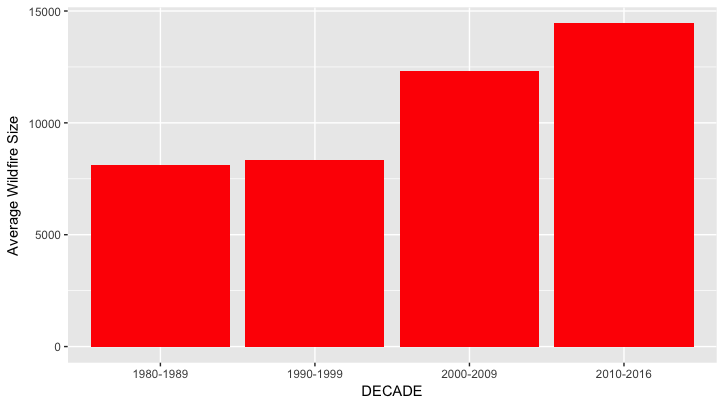
 [dt_sc_h3]Average Wildfire Size is Increasing[/dt_sc_h3]
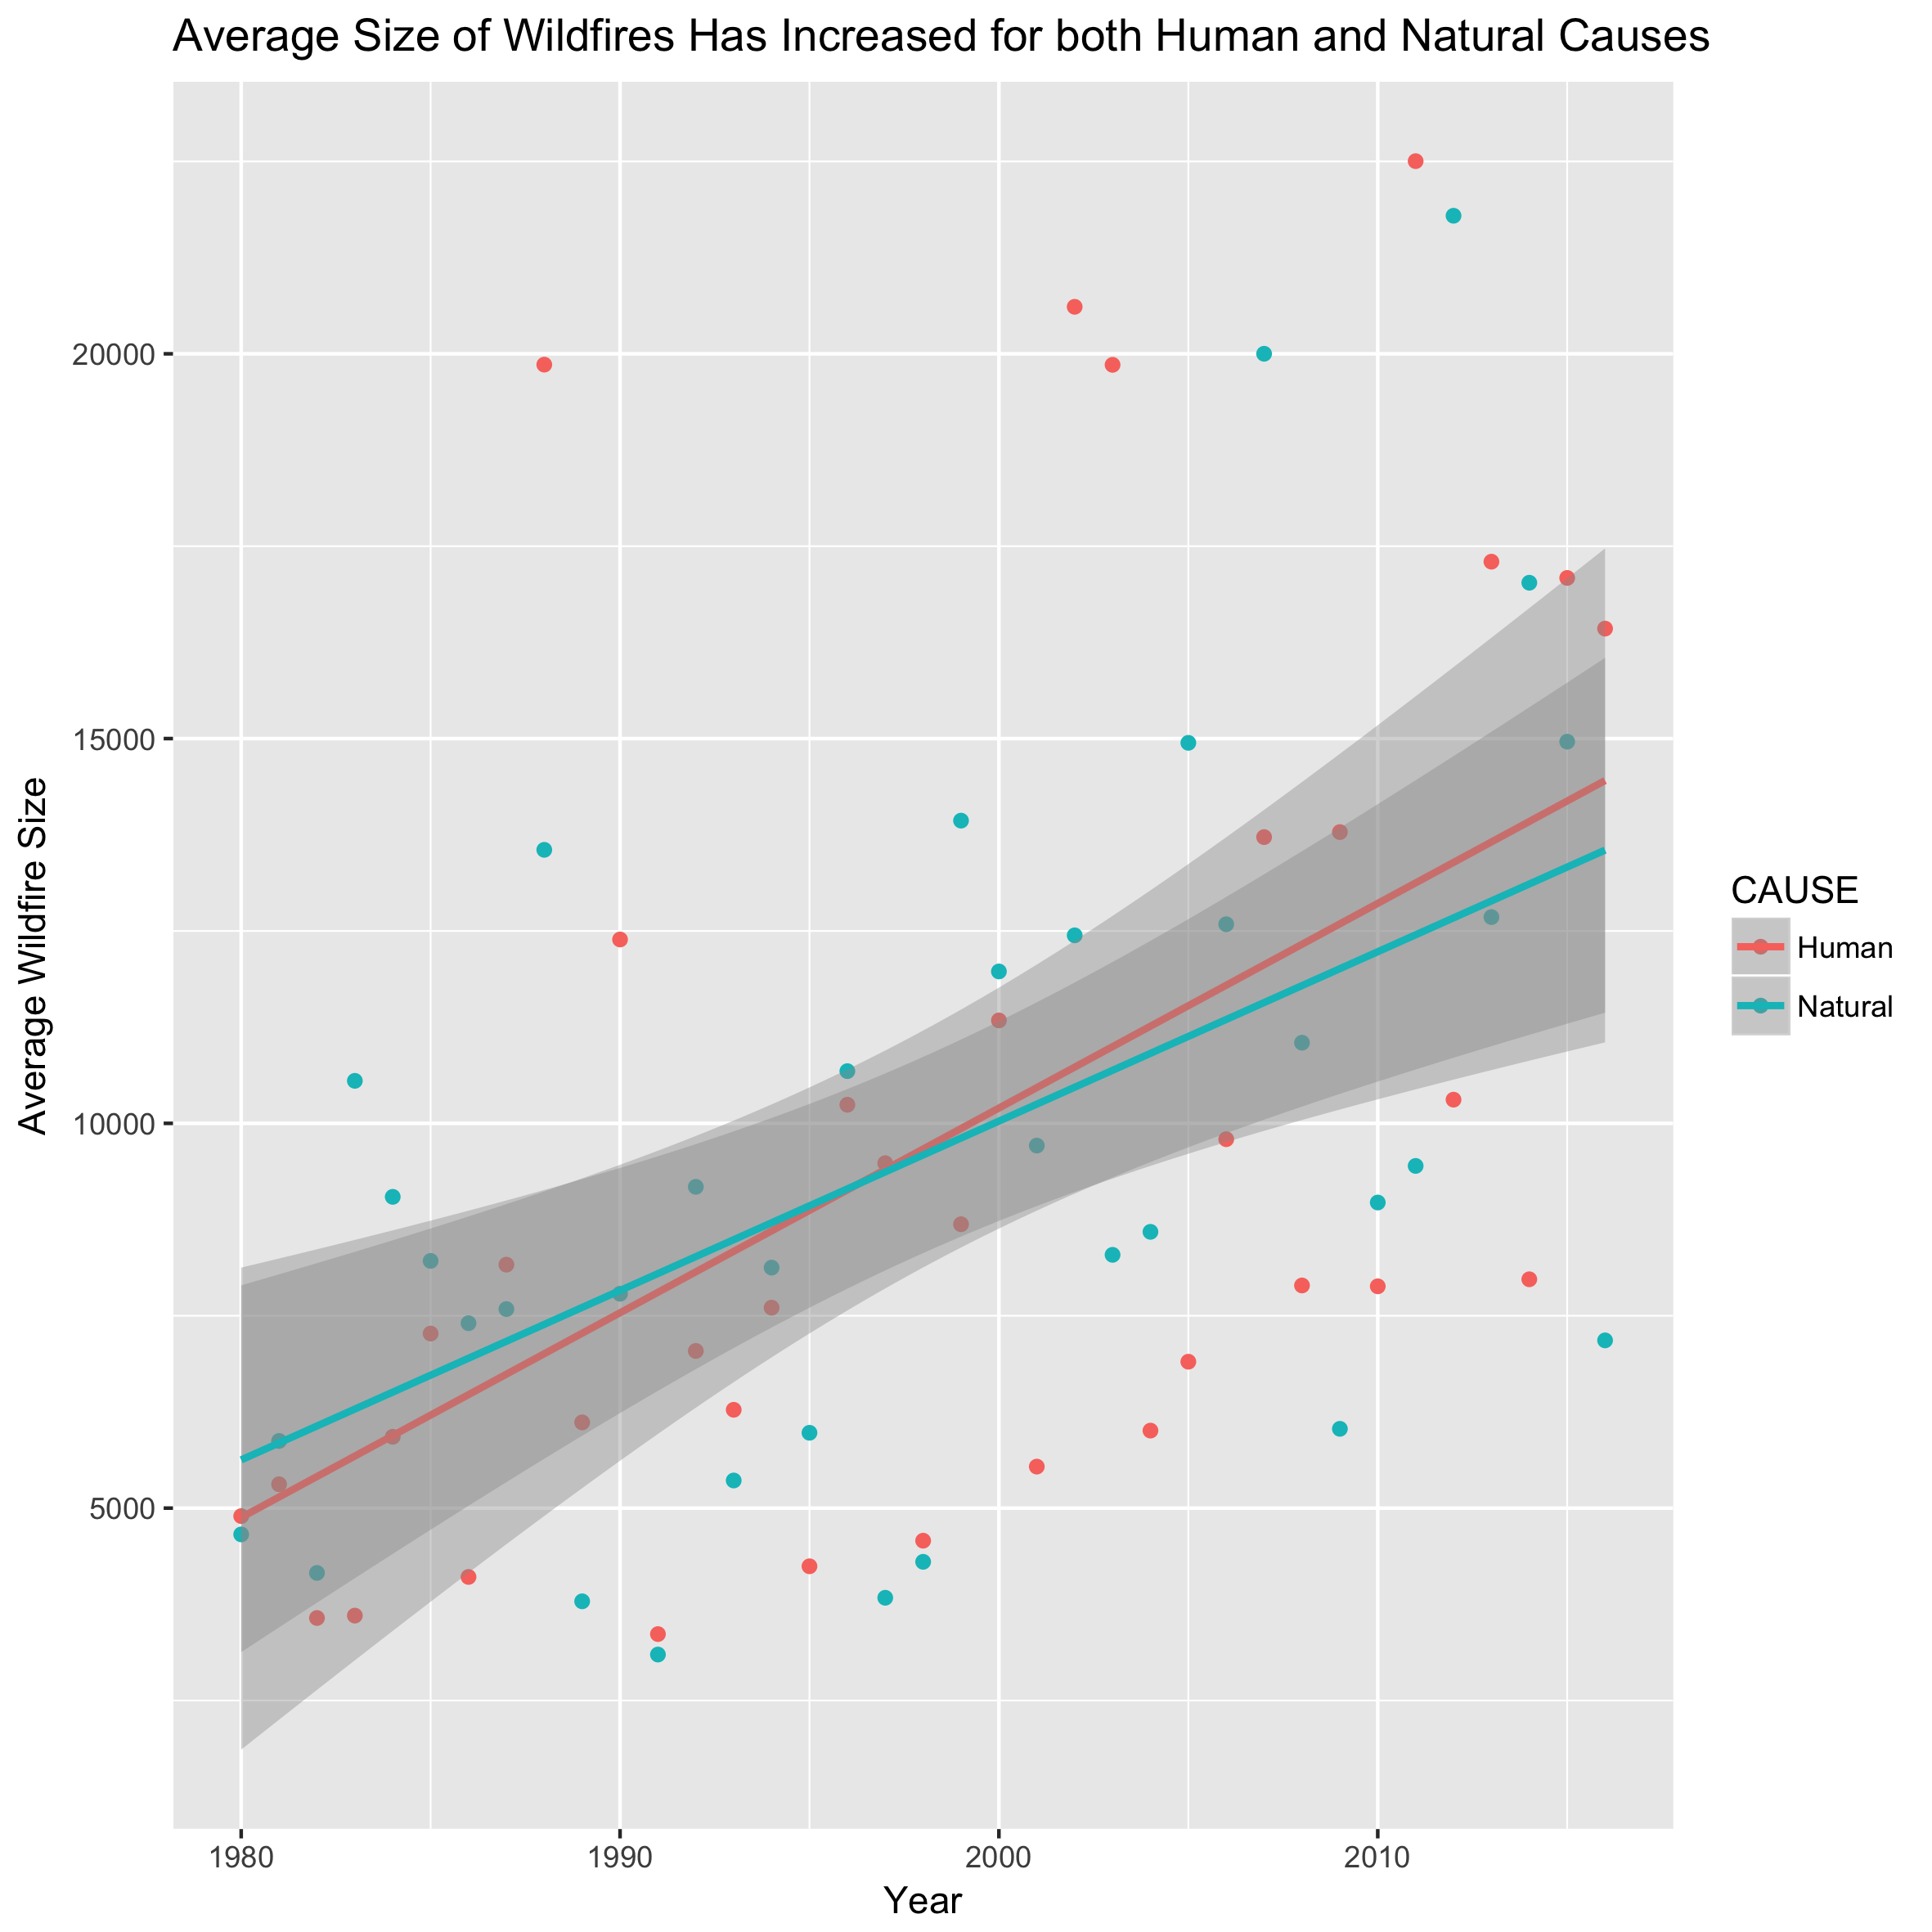
[dt_sc_h3]Wildfire Size by Cause[/dt_sc_h3]
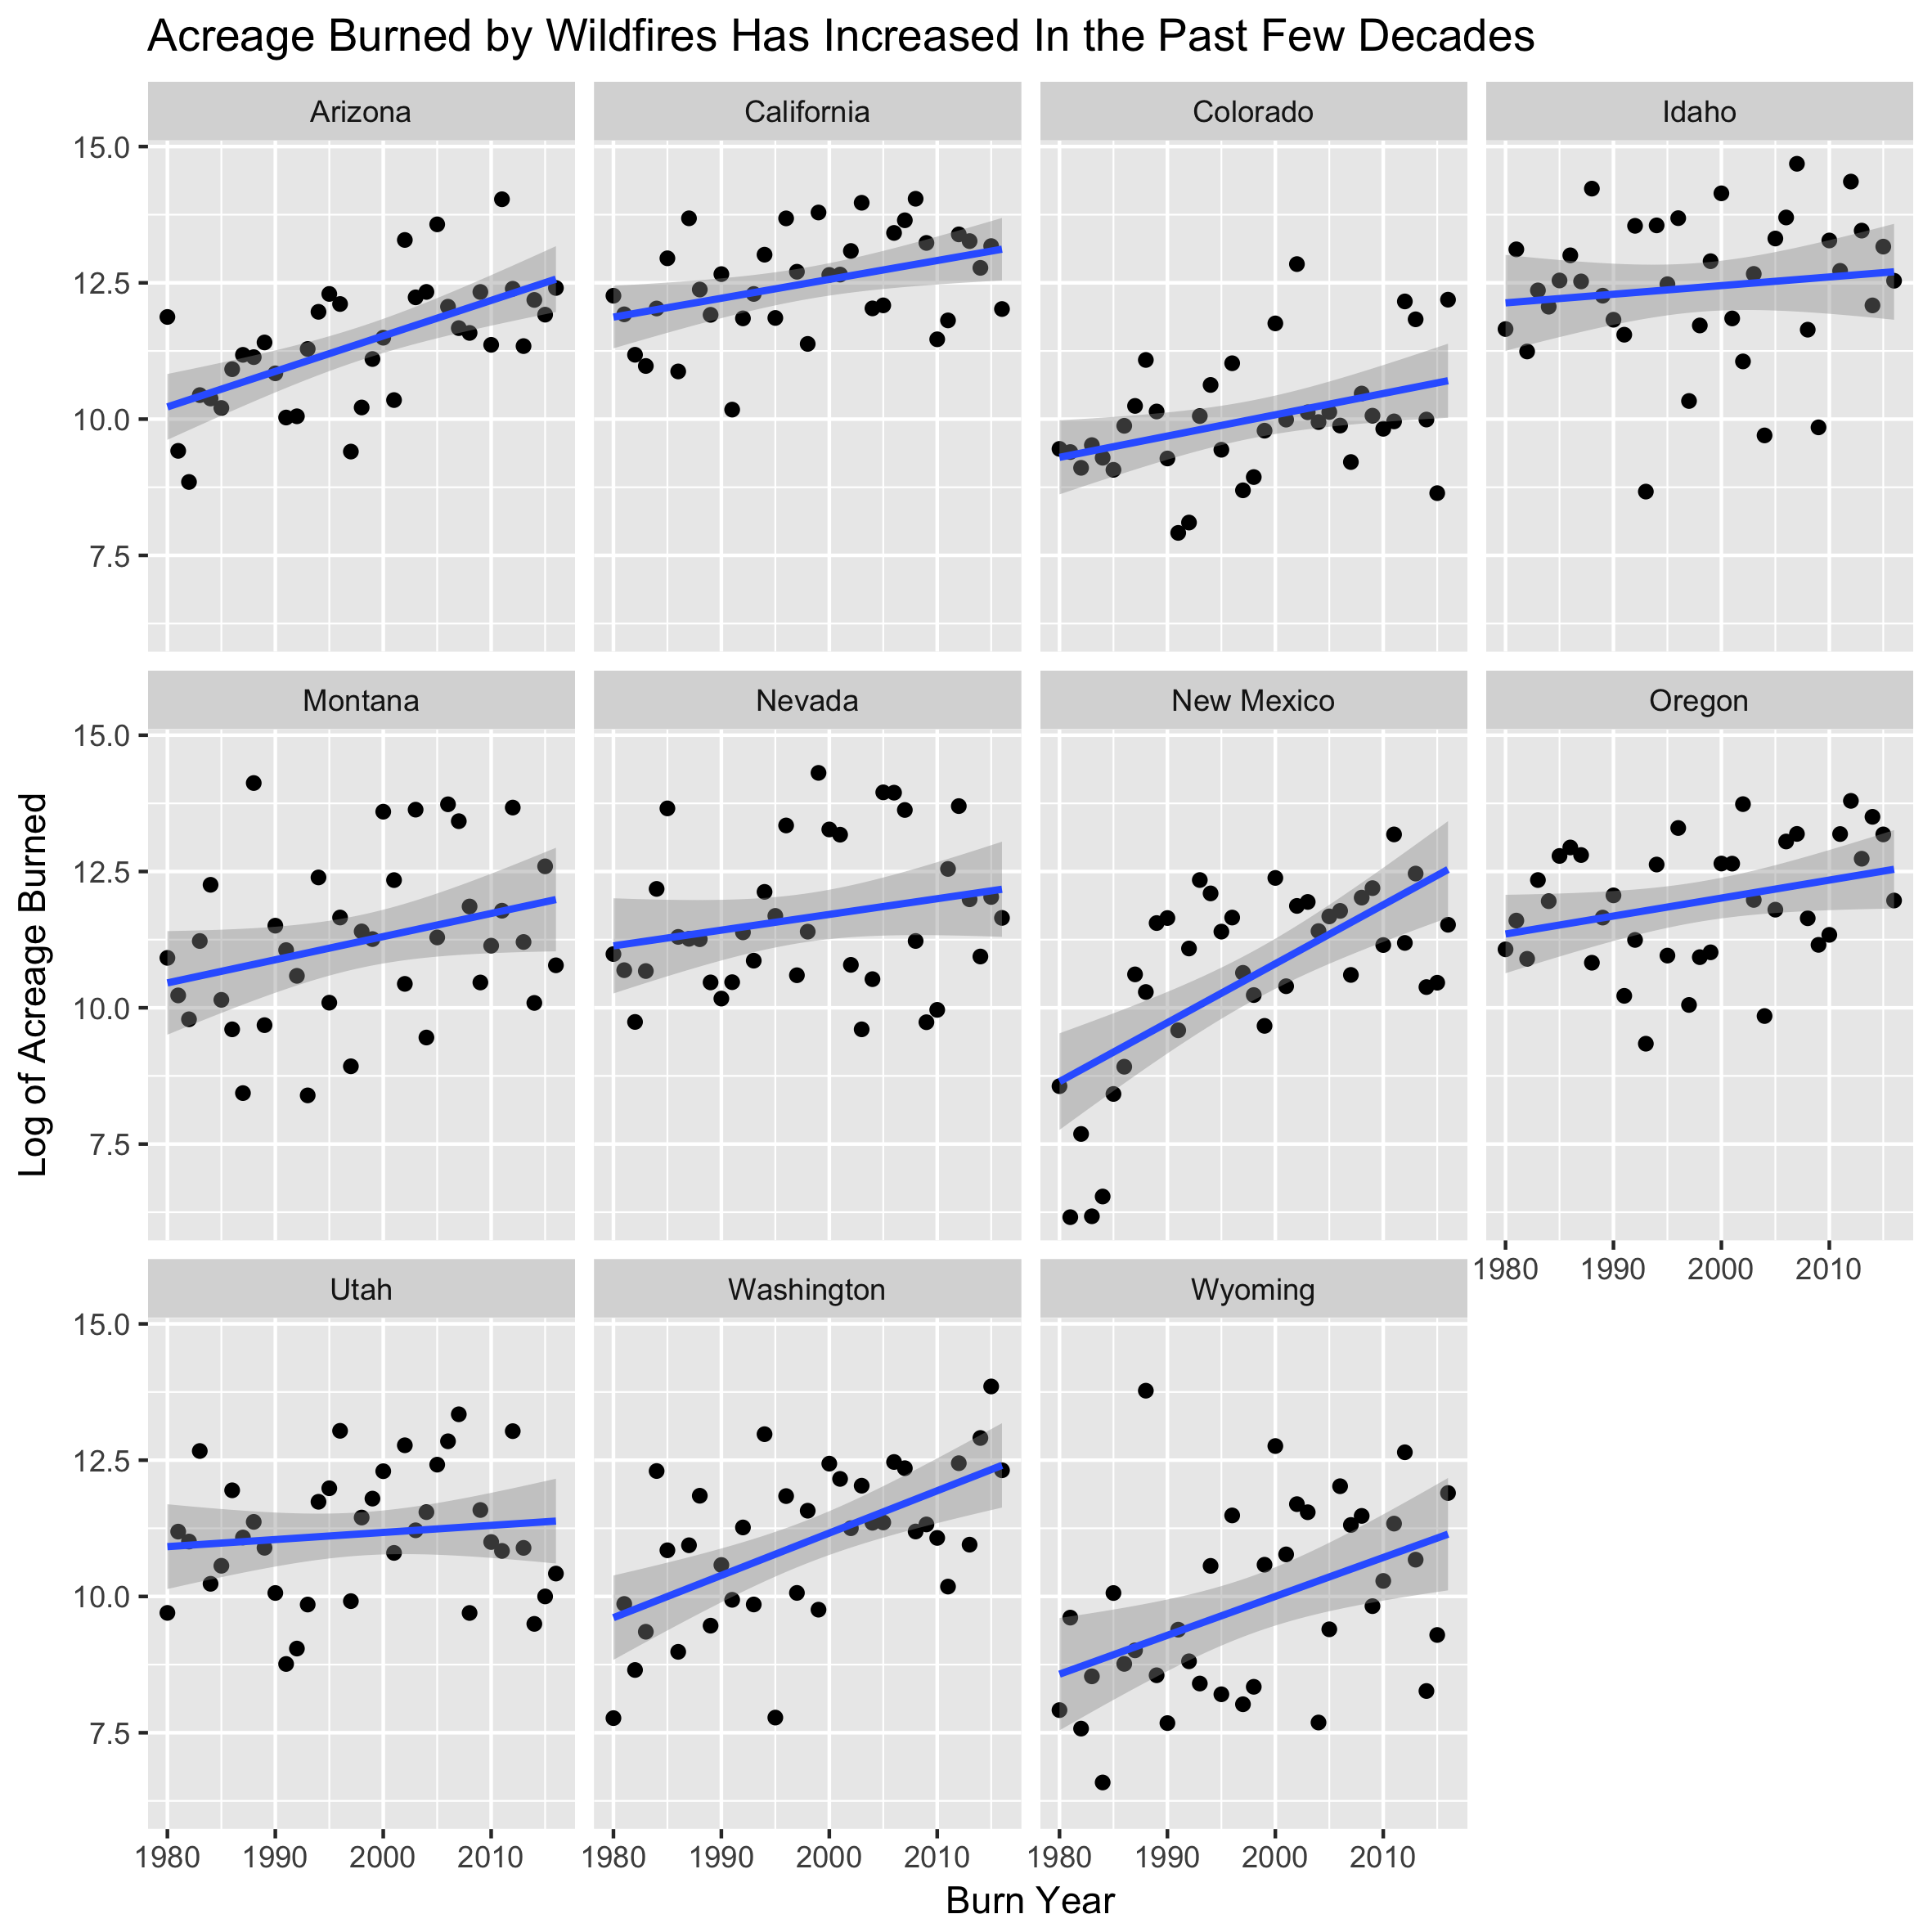
[dt_sc_h3]Acreage Burned by State[/dt_sc_h3]
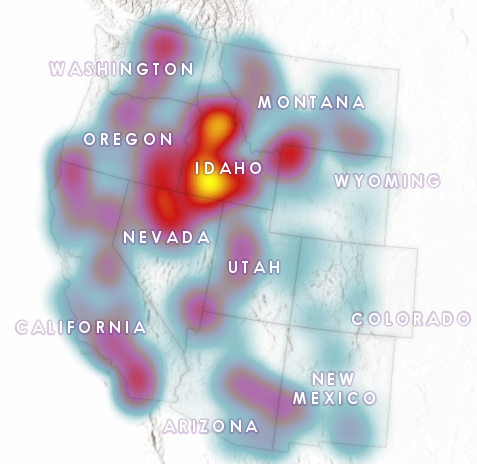
[dt_sc_h3]Heat Map Weighted by Acreage Burned[/dt_sc_h3]
Want to learn more about how to create visualizations using ArcGIS and R? Take a look at some of our classes on these topics. Don’t forget that you can save up to 20% on any of these classes during our Anniversary Sale in the month of May.
R for Data Science: Programming and Efficient Data Managemen
Introduction to Spatial Statistics using ArcGIS Desktop and R
Learning ArcGIS Pro 1: Maps and Projects
Learning ArcGIS Pro 2: Editing, Analysis, and Automation
Learning ArcGIS Pro 3: Converting, Linking, and Analyzing Data
Learning ArcGIS Pro 4: Sharing Your Maps and Data
Complete Live Class Schedule
Have a large group of students that need training? We can come to your site to teach any of our classes.
