
It has been rare that I have had to venture back into Map Viewer Classic from the new Map Viewer. For one thing, I haven’t wanted to because of the awesome functions and cartographic features available in the new Map Viewer. The most consistent reason for my going back in time to Classic has been for the analysis functions that it provided. As of February of this year (2023), Analysis has been implemented in the new Map Viewer, which means I will no longer need to jump into classic for anything. So long Classic! And thanks for all the memories.
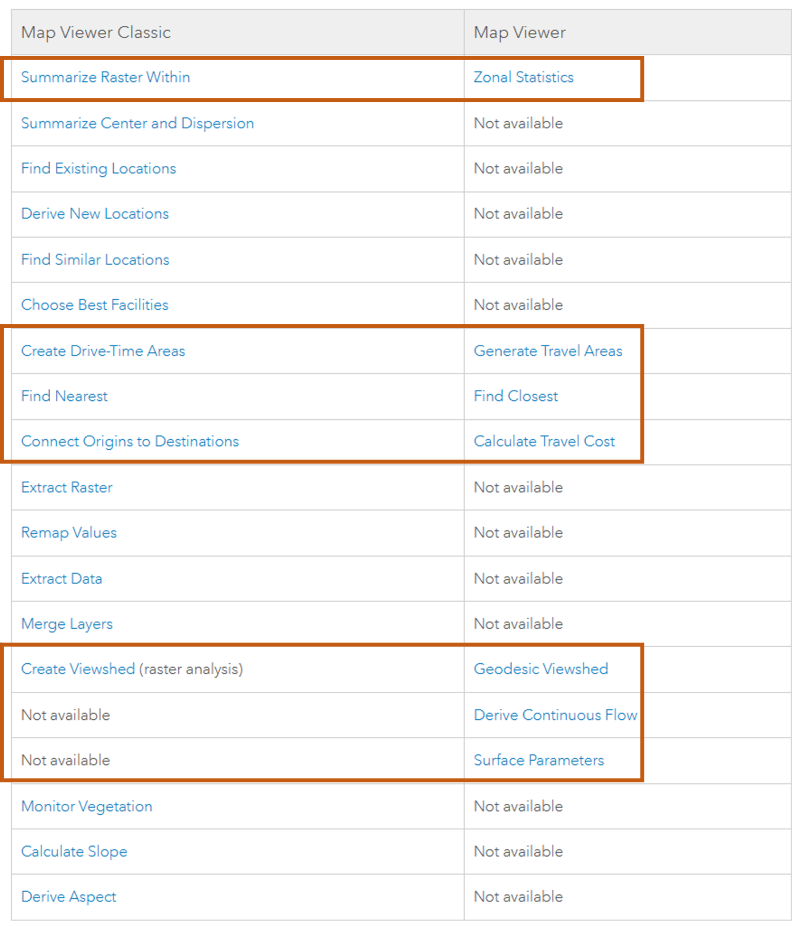
Ok, that might be a very slight exaggeration. MOST of the tools that were available in Classic are available in Map Viewer with the exception of a handful. The below table provides a list of the tools that have been renamed in the new Map Viewer (outlined in orange) and those that are not yet available. As you can see, the list of unavailable functions is quite small compared to the number of available tools that have been migrated.
What is Notably New?
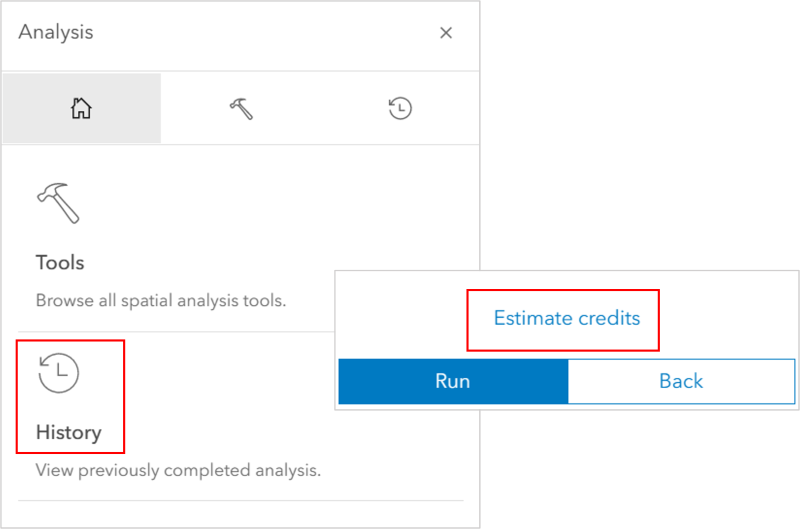
Most notable of the new features for Map Viewer analysis are the ability to view a history of tools that have been run and the ease in which we can now estimate the credit usage. Much like ArcGIS Pro, you can view the history of successful and unsuccessful runs of tools, as well as click a tool to rerun it with the same settings as you ran it with previously. This saves time in having to reinput tool parameters when running the same analysis multiple times.
The tool history is saved with the web map, so it can be viewed by other users who the web map is shared with. However, the history details will not be saved until you save the web map, so if you use a few tools and then exit your map without saving, you will lose the history items associated with those tools.
The details included in the history items are listed below:
- The tool input, output, and other parameter settings.
- Any environment settings.
- When the tool was run, when the tool finished running, and how long it took to run.
- The amount of credits consumed.
- Whether the tool completed successfully or failed.
- Any information, warning, or error messages.
- Links to created items.
What kind of tools are available?
Both Feature and Raster Analysis tools are available, however you must have the ArcGIS Image for ArcGIS Online user type extension for the latter.
You can easily tell the difference between Feature and Raster analysis tools by their icon. Feature Analysis tools have a lone hammer while Raster Analysis tools have a hammer on top of a matrix of cells.
What data types are supported for input?
Data must first be added to the map to be used in the analysis, so you won’t be able to point to any input data not listed in your map contents pane. Feature Services, Hosted Feature Layers, and Tables can be data inputs for Feature Analysis tools. One thing to keep in mind is the data must be accessible to the online tool and not closed behind a firewall. This means any Feature Services published through an ArcGIS Server environment must have a publicly accessible URL to be used as in input.
Inputs for Raster Analysis can be Image Services, Hosted Imagery Layers, and a Deep Learning Package File (.dlpk). The same rule applies as above when it comes to any Image Services published through an ArcGIS Server; they must have a publicly accessible URL to be used as input. Deep Learning Package Files contain the data and files required to run deep learning tools for object detection or image classification.
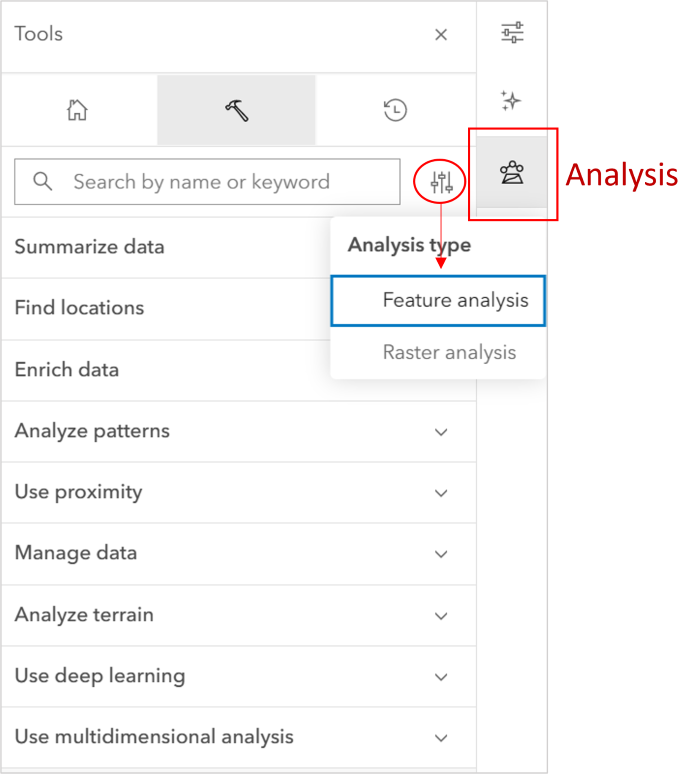
How do I find tools?
Map Viewer has a nicely streamlined approach to finding the tool you need or exploring the tools available to you. Once you click into the Analysis Tab from the Setting Panel (white panel on the right) and click into the Analysis tools list (hammer icon), you can search for a tool by keyword, or you can filter the tools listed for you by analysis type (either Feature or Raster). The filter is useful to limit the types of tools for you to browse, especially for those of you that don’t have access to the extension that allows you to run Raster Analysis. After all, why waste time wading through a list of tools you can’t access?
How do I run an Analysis?
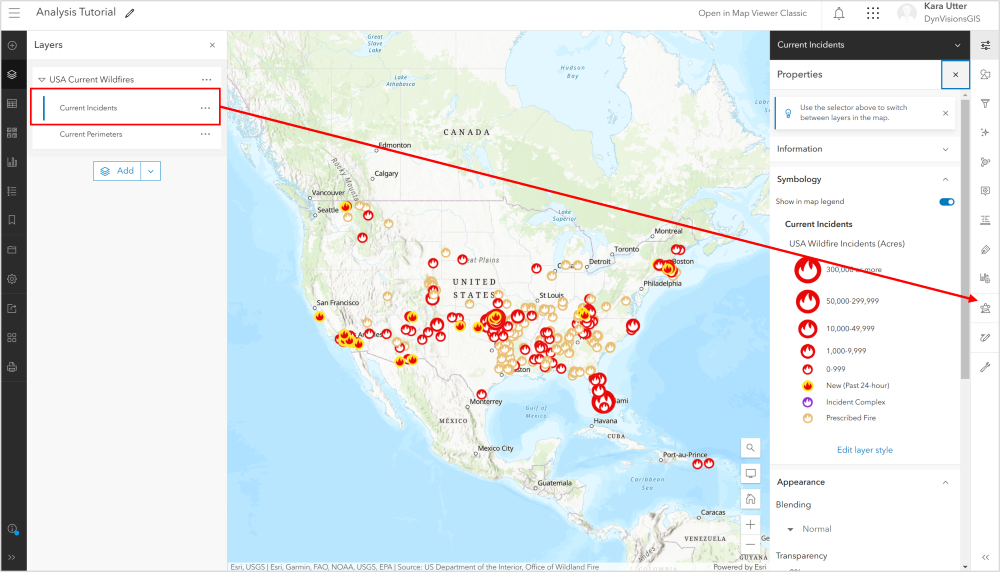
For this demonstration, I have added the USA Current Wildfires feature layer to my map. This layer is hosted and maintained by ESRI based on the authoritative wildland fire data points sourced from Integrated Reporting of Wildland-Fire Information (IRWIN) and wildland fire perimeters from National Interagency Fire Center (NIFC).

From the Map Viewer, the first think I will do is make sure I have selected the Fire Incident (Points) layer from the Contents Menu on the left. Once selected, I will open the Analysis panel by clicking on the Analysis icon from the light-colored menu on the far right. As a note, you don’t have to select the point layer first, you could have selected the USA Current Wildfires group instead and still have found the Analysis icon available to you from there. What you have selected won’t make a difference in the options that are shown to you.
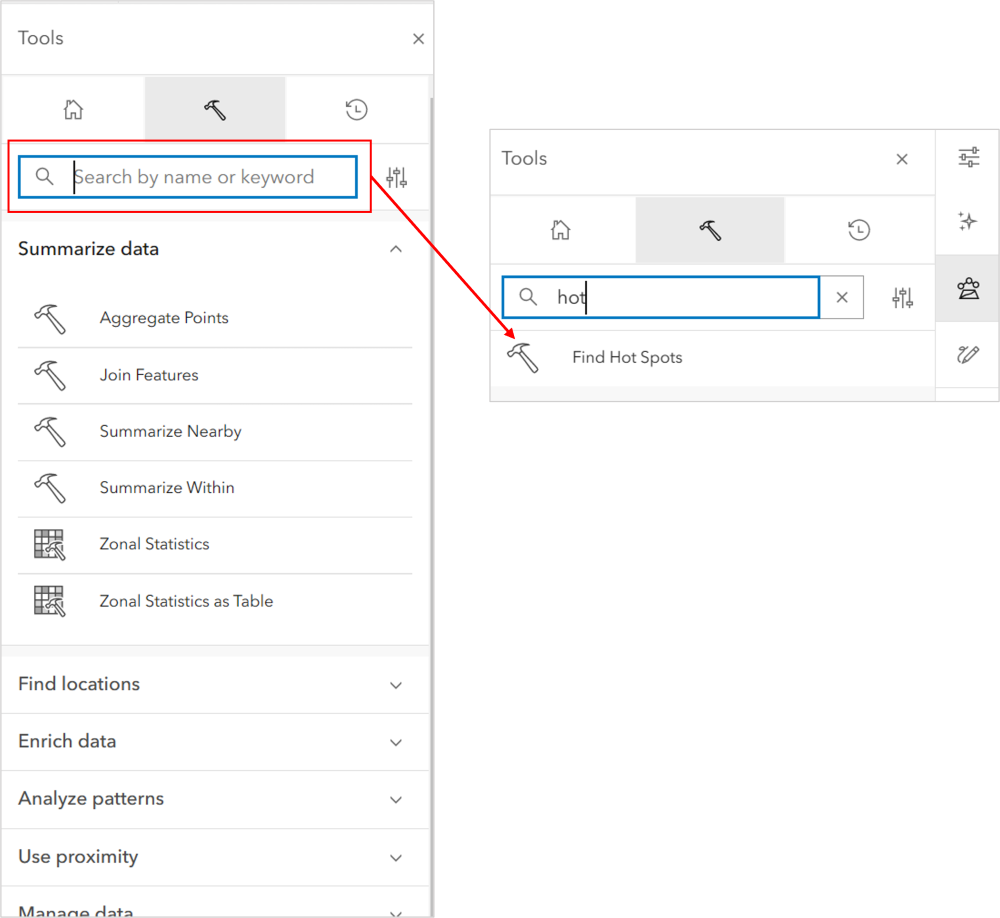
I already know that I want to find hot spots in the current wildland fire incidents data, so I am going to type in “Hot” into the search bar. As you type, the list of tools will automatically filter for you. When the Find Hot Spots tool appears, I am going to select it.
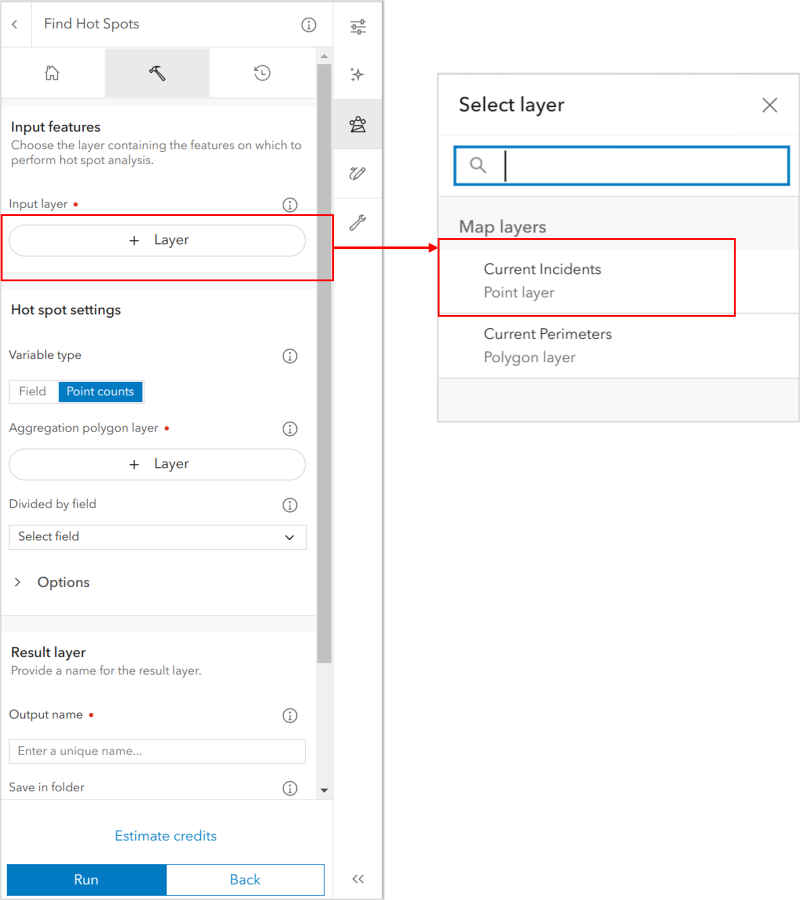
The nice thing about Map Viewer analysis tools is that anything that is required will have a small red dot next to it, making it easier to understand the minimum input parameters necessary to run a tool. The first input parameter is the Input Feature dataset. When I click on the “+ Layer” button, a list of available data inputs appears. From this list, I am going to select the Current Incidents point layer.
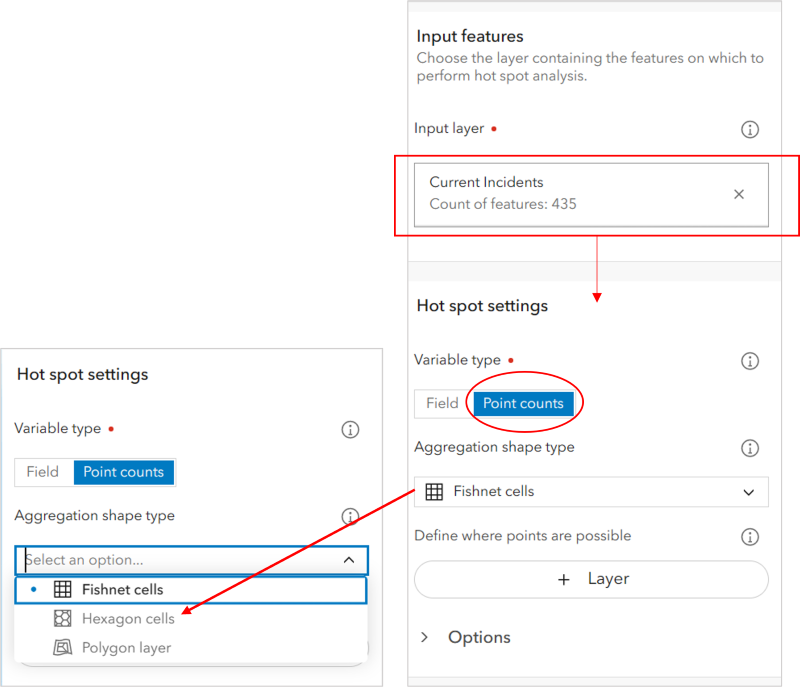
Once I choose an input feature layer, other parameters associated with that input type will appear in the Hot Spot Settings section below. For the purposes of this demonstration, I am going to choose to create hot and cold spots using point counts based on location instead of being based on a field value. So, I will leave the Variable Type as Point Counts and also change the Aggregation Shape Type to Hexagon Cells.
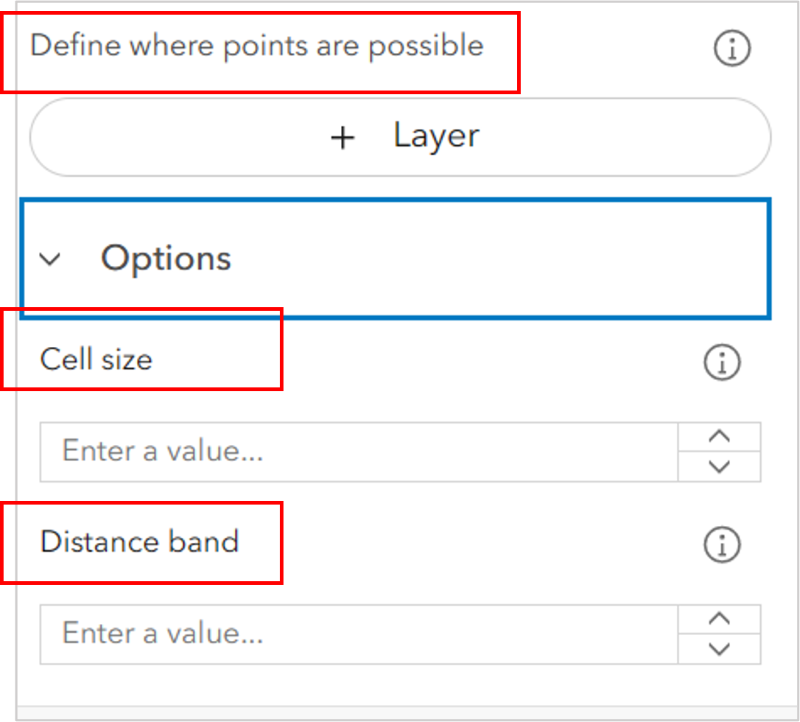
The optional Hot Spot settings available to me are to choose a boundary layer that will help define the area want the analysis to be limited to or define the cell size and distance band (neighborhood) of the hexagon cells, but for the purposes of this demonstration I will leave these parameters unused.
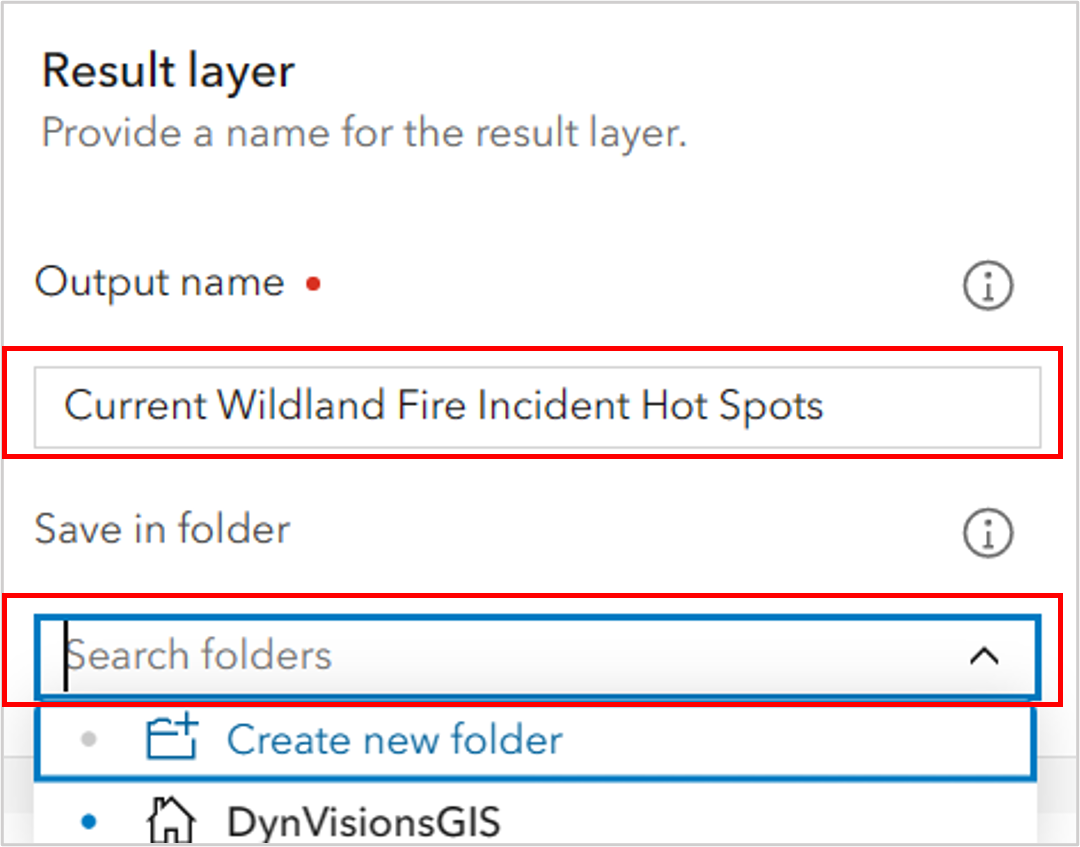
The next step is to name the Resulting output layer and choose a folder location for it to be saved to.
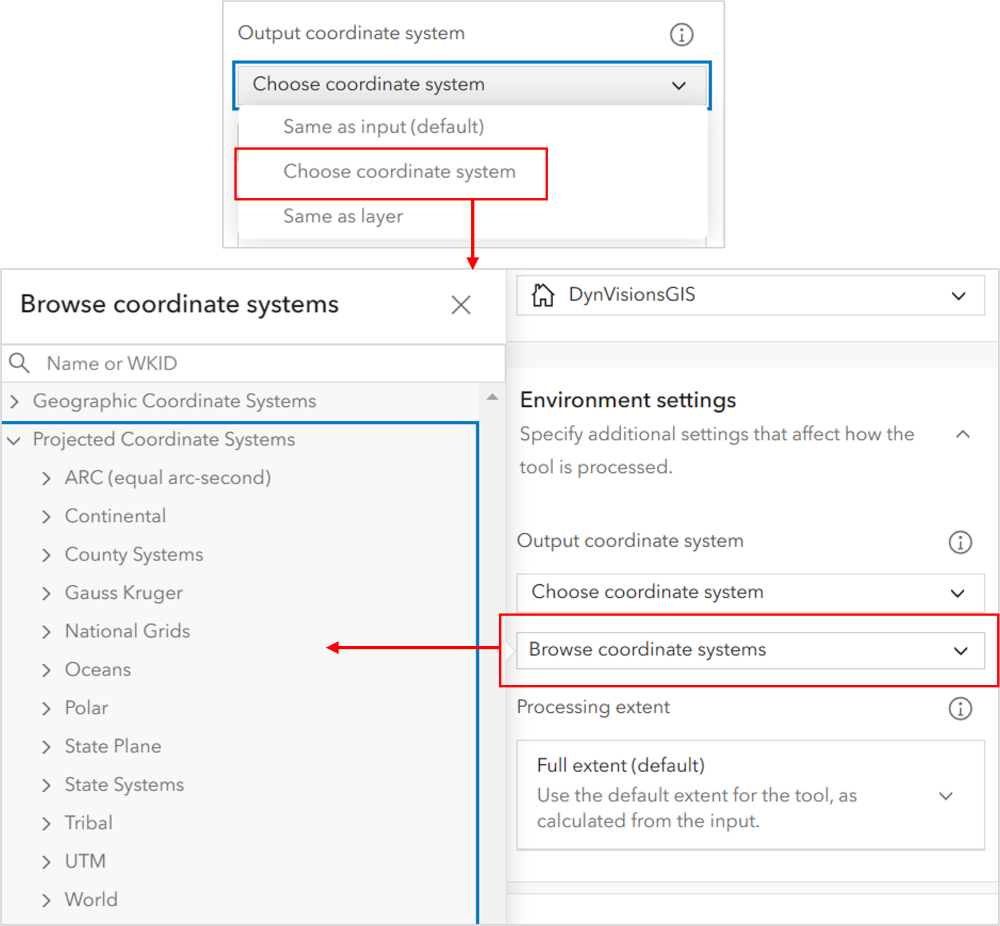
I could either choose to run the tool from here, or I can set additional Environmental Settings. Currently the Environmental Settings options include the ability to set the output coordinate system and the processing extent.
The coordinate system does not have to be the same as the input feature layer, but for this demonstration I will leave that setting as the default.
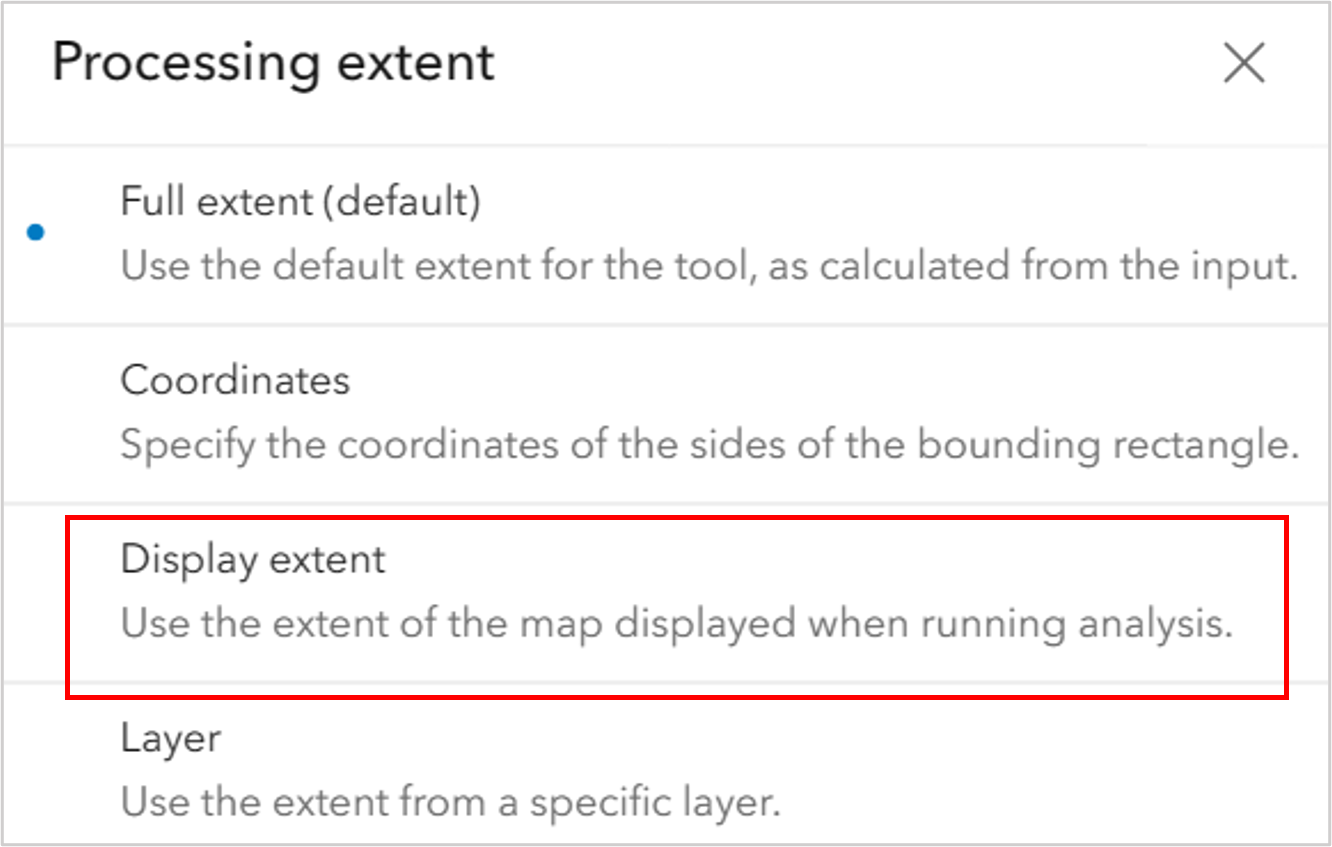
The processing extent options include the follwoing:
- Full Extent of the layer’s records
- Coordinates to specify a bounding envelope
- Display Extent to only process those points within my map display extent
- Layer extent, which is the extent defined on the actual feature layer
I know that I must have at least 60 features processed for the Hot Spot Analysis, so after I choose Display Extent, I am going to zoom into the Southeast US where the majority of current wildland fire incidents are taking place (mostly in the form of prescribed burns).
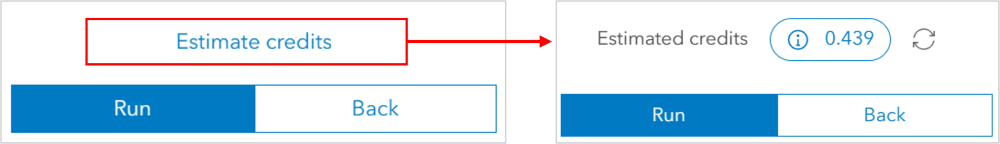
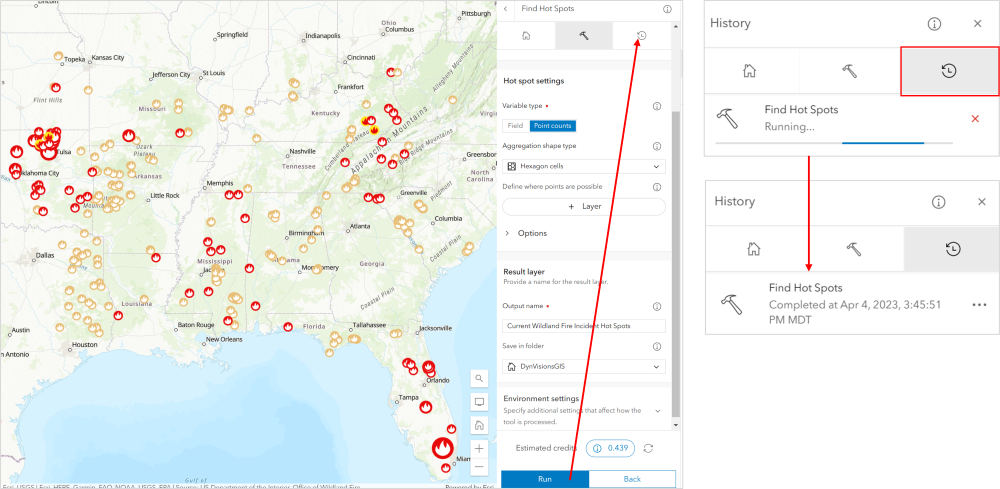
Now that all my parameters are configured, I will estimate the credit usage and then run the tool. The credit usage for this analysis is small, so it won’t be a huge impact on my credit costs.
After I click on “Run”, the tool’s process can be viewed in the history tab of the analysis pane. Once the tool has completed, the resulting layer will be added to the map and the history pane on the right will show the tool as completed.
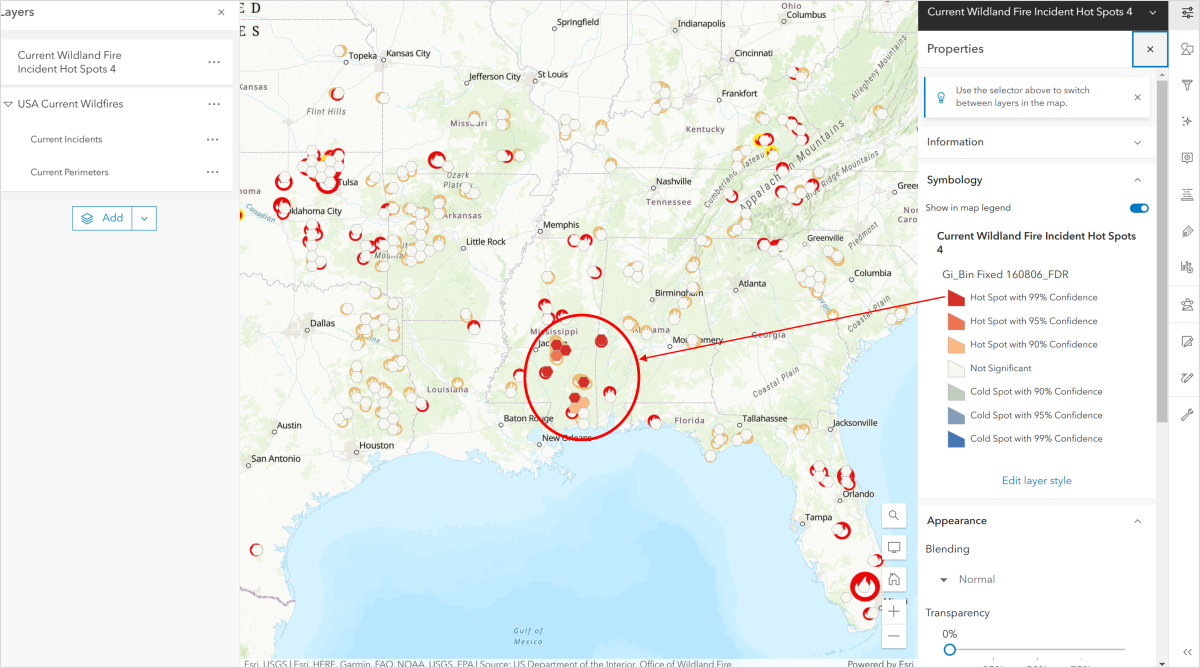
As you can see in the image below, the resulting hexagon layer shows significant hot spots mostly in southern Mississippi with one hot spot being located in eastern Alabama. All other areas have resulted in insignificant hot spots.
I hope you have enjoyed this introduction to analysis in the new Map Viewer.
