

With every iteration of Experience Builder comes extended functionality and new and improved ways of configuring your application widgets. Experience Builder (EB) will be replacing Web AppBuilder (WAB), and sooner than later, so finding the same functionality in EB for popular WAB widgets is important. EB may not have as many widgets as WAB at this point, but that doesn’t mean the functionality you need is not already present.
For example, the Public Notification widget in WAB has a very specific function and has been a powerful widget for many organizations over the years. EB doesn’t have this widget, and might not ever, but what it does have is a Query widget that allows you to set a Spatial Buffer filter. When features are selected that intersect with this buffer, your users have the ability to export the selected records to a CSV. So the functionality is there, but the way you get to the final result is quite different.
In this tutorial, you will learn how to configure the Experience Builder Query Widget with a Spatial Buffer of 300 feet, resulting in a selection of parcels that can be exported to a spreadsheet.
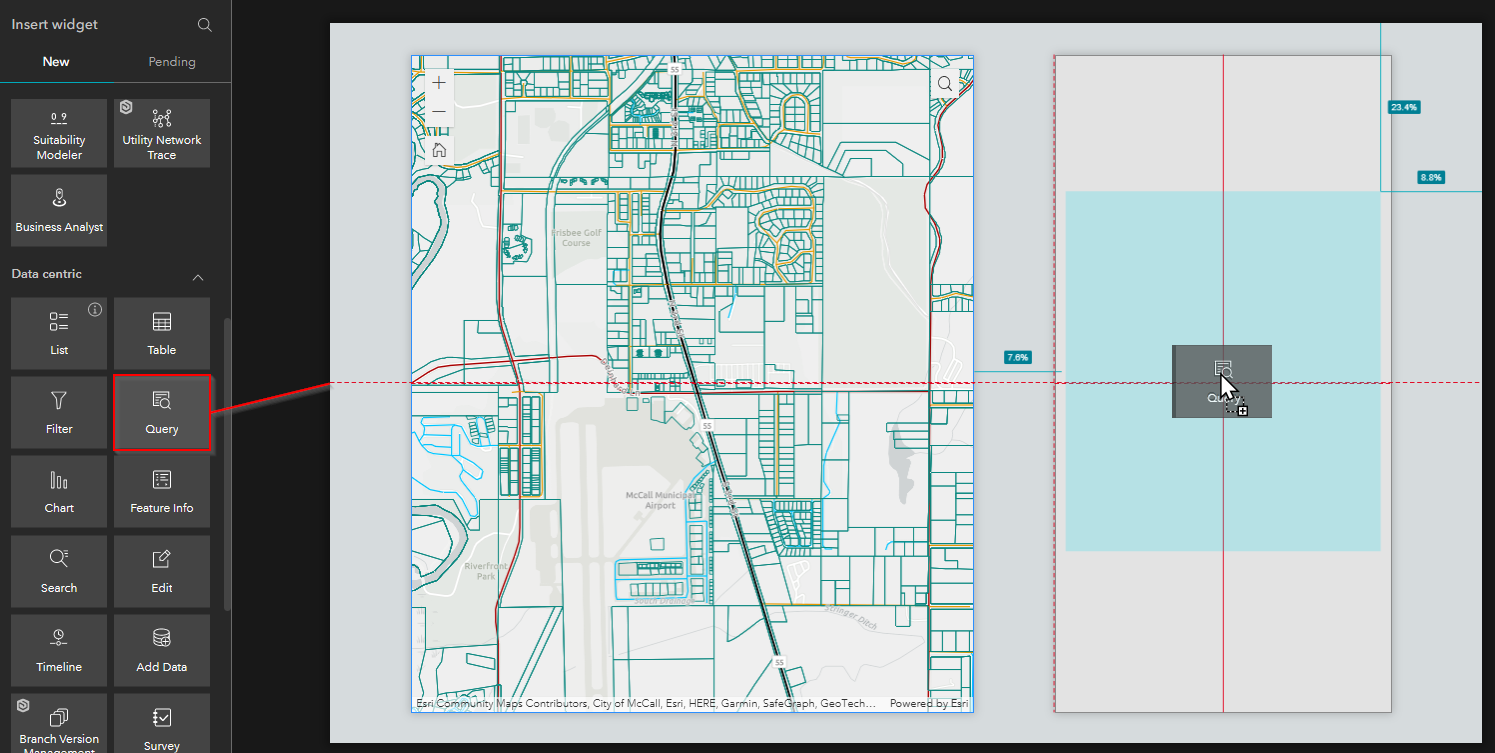
For the purposes of this tutorial, a web map with parcel features has already been created and the map widget has already been added to a blank EB template. So, the next thing you need to do is pull the query widget onto the canvas next to the map.
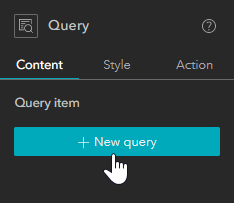
With your query widget added and selected, you should see its configuration panel open on the right. From this panel, click on the “+ New Query” button.
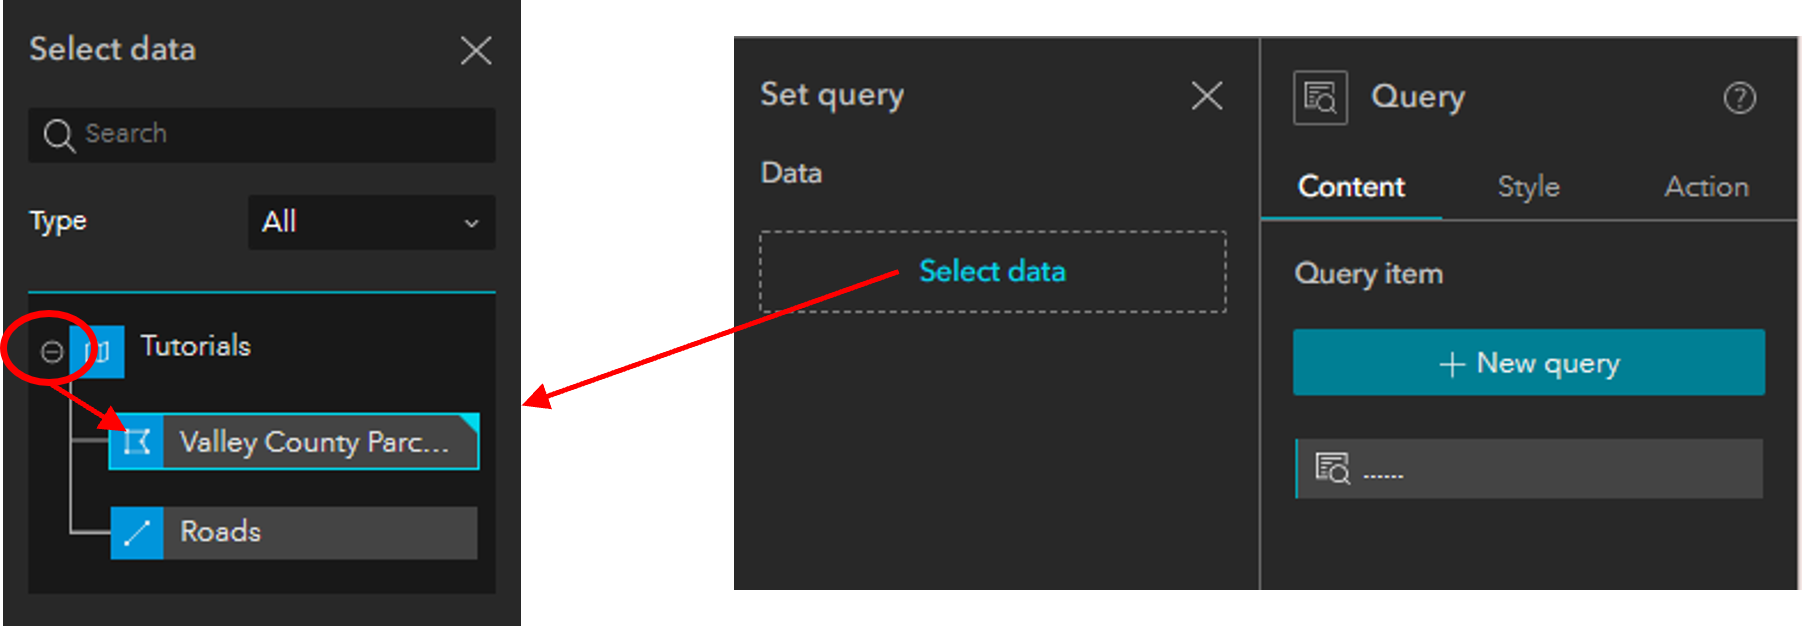
When the extended panel appears, click on the “Select Data” option. If your map item has not been added as a data item, yet, you will need to click on “+Add New Data” at the bottom of the panel and then search for and add your map item. Once your map item is added, click on it to select it in the Select data panel in EB. In the image below, our map item is called, “Tutorials” and when we clicked on it, a list of the map’s feature layers appeared. From the layers list, you will need to choose the parcels feature service that contains the mailing address data for public notifications.
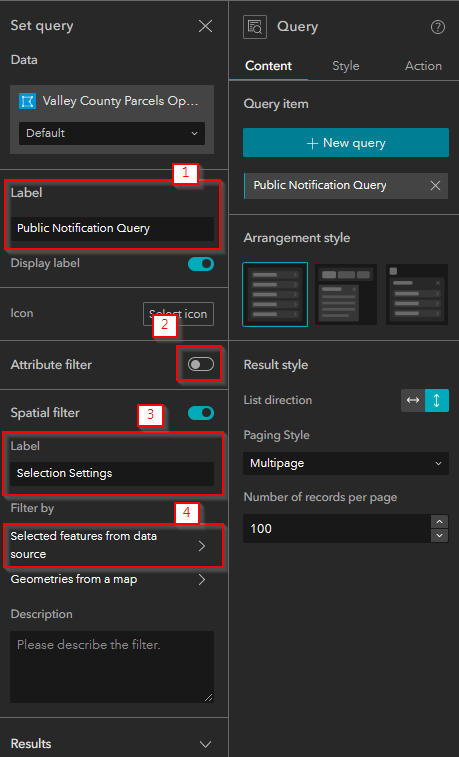
When you select the Parcel layer from the map to connect it to your query widget, the query settings appear. When these settings appear, do the following:
- Change the primary label to “Public Notification Query”
- Turn off the Attribute Filter, because we only want to create a spatial filter.
- Change the label of the spatial filter to “Selection Settings”
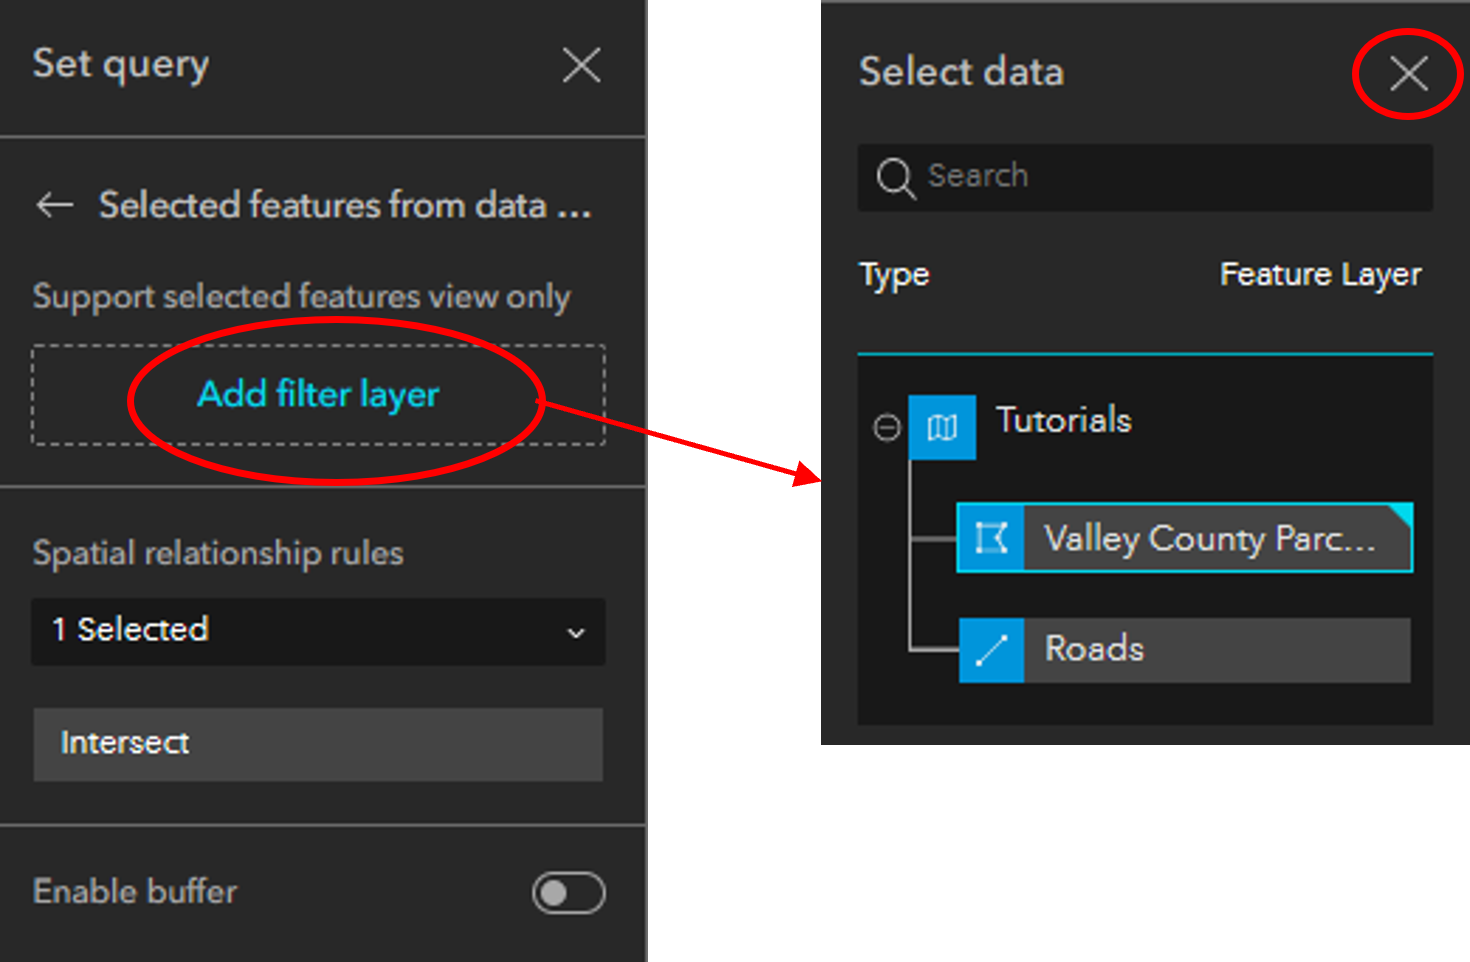
- Click into the option under “Filter by” that says, “Selected Features from Data Source”
This panel is where you will choose the layer that will contain the selected feature to run the spatial buffer query with (see below image). Again, you will choose the parcel layer because Public Notifications are typically created in response to property notices. Alternatively, you could choose to add another layer, such as roads, and the spatial buffer query would then buffer a selected road feature instead. If you added both roads and parcels as filter layers, your users would have the option to choose which layer they want to run the buffer on. Once you add your filter layers, you will need to click on the X in the upper right of the Select Data panel to return to the Set Query panel.
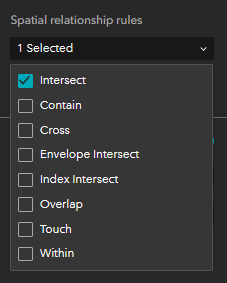
The next step is to set the relationship rules. In other words, when your buffer is created on the filter layer, what is the relationship that will select the features for your list? If this is going to be a specific tool only for public notification queries, then you can just leave the default of intersect and only those features that intersect the buffer will be filtered. However, if you want to build a flexible too that allows users to choose the relationship of their filtered features, then you can choose multiple options which will allow the user to choose a relationship at runtime. For the purposes of this tutorial, we are going to leave the relationship as “Intersect”.
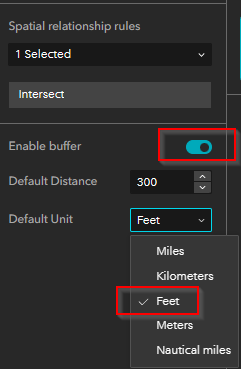
Once the relationship rules are set, you will enable the buffer and then set the default distance and units. Regardless of what you set as the default distance and units, the user will be able to alter these parameters at runtime. Because this tutorial is based on a Public Notification Query example, we are going to set the default distance to 300 and the default unit to Feet.
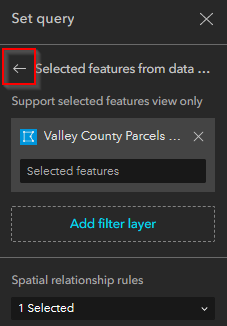
Click on the back arrow to return to the main Set Query panel.
From the main Set Query panel, scroll down until you find “Results”. Click to expand the Results section. This is where you will determine what your filtered list will look like and what information the user will have access to within the list. The default settings are to configure each record in the list according to the web map settings. What this means is that the list layout will be determined by the pop-up configuration for your feature layer within the web map.
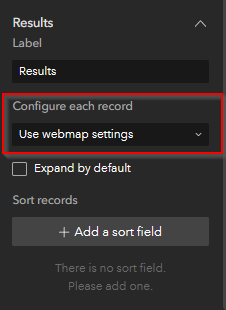
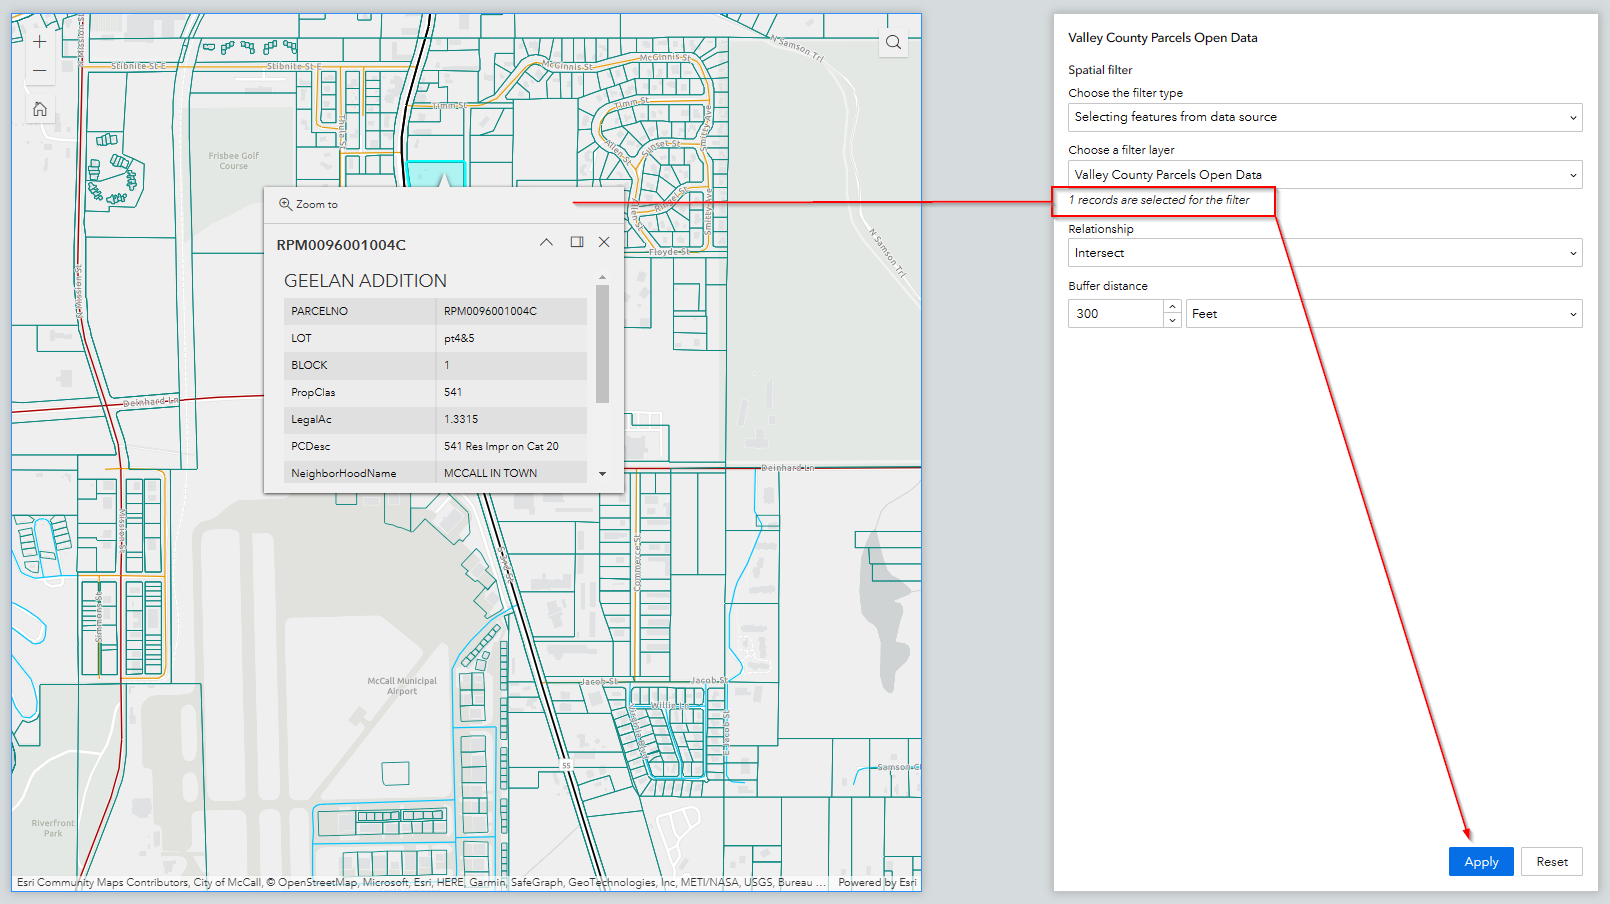
For the purposes of this tutorial, we are going to leave this setting as it is. Save your Experience and then click to preview the application. First, select a parcel from the map. When you do this, you will see a message appear that says, “1 records are selected for the filter”. Click on “Apply” in the lower right.
When the feature list appears, you can immediately determine how many features were selected based on their relationship of intersecting the 300-foot buffer that was created from our selected parcel. In the example below, there are 42 features. When you click on a parcel number, the full feature information appears. The information displayed is based on the pop-up configuration from your web map. When you click on the data action button in the upper right corner of your list, you will find your option to export all to CSV.
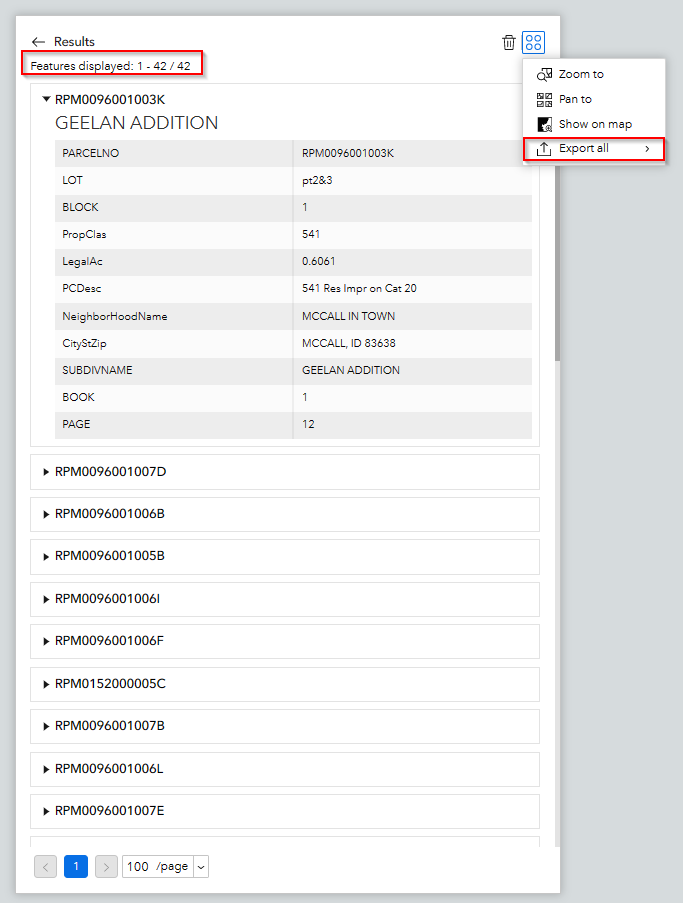
It is important to note that all of your attributes will be exported to CSV, regardless of what is viewable in the pop-up of your web map. If you want to tailor this application for a public notification query that results in only mailing address information, then you might consider creating a view of your feature service with only these fields.
One last note is that your feature service settings must allow others to export to a different format for you to be able to export the list to CSV. These settings can be found directly in your hosted feature services settings in ArcGIS Online, outside of the EB application builder.
Click below to watch a live tutorial demonstration on YouTube:
