
Animated maps, like the one you see below, provide a powerful enhancement to show how data evolves over time. In this tutorial you’ll learn how to use R with the ggmap, tidyverse, and gganimate libraries to produce animated maps like you see below. This animated map displays wildfire activity in the State of California from 1980 – 2016. Each fire is depicted with a point and is further enhanced through the use of color coding and sizing to depict the size of the wildfire.
You can download the R script and dataset used to produce this animated map if you’d like to try it out. Spend some time examining the dataset to get a better feel for the structure of the data.
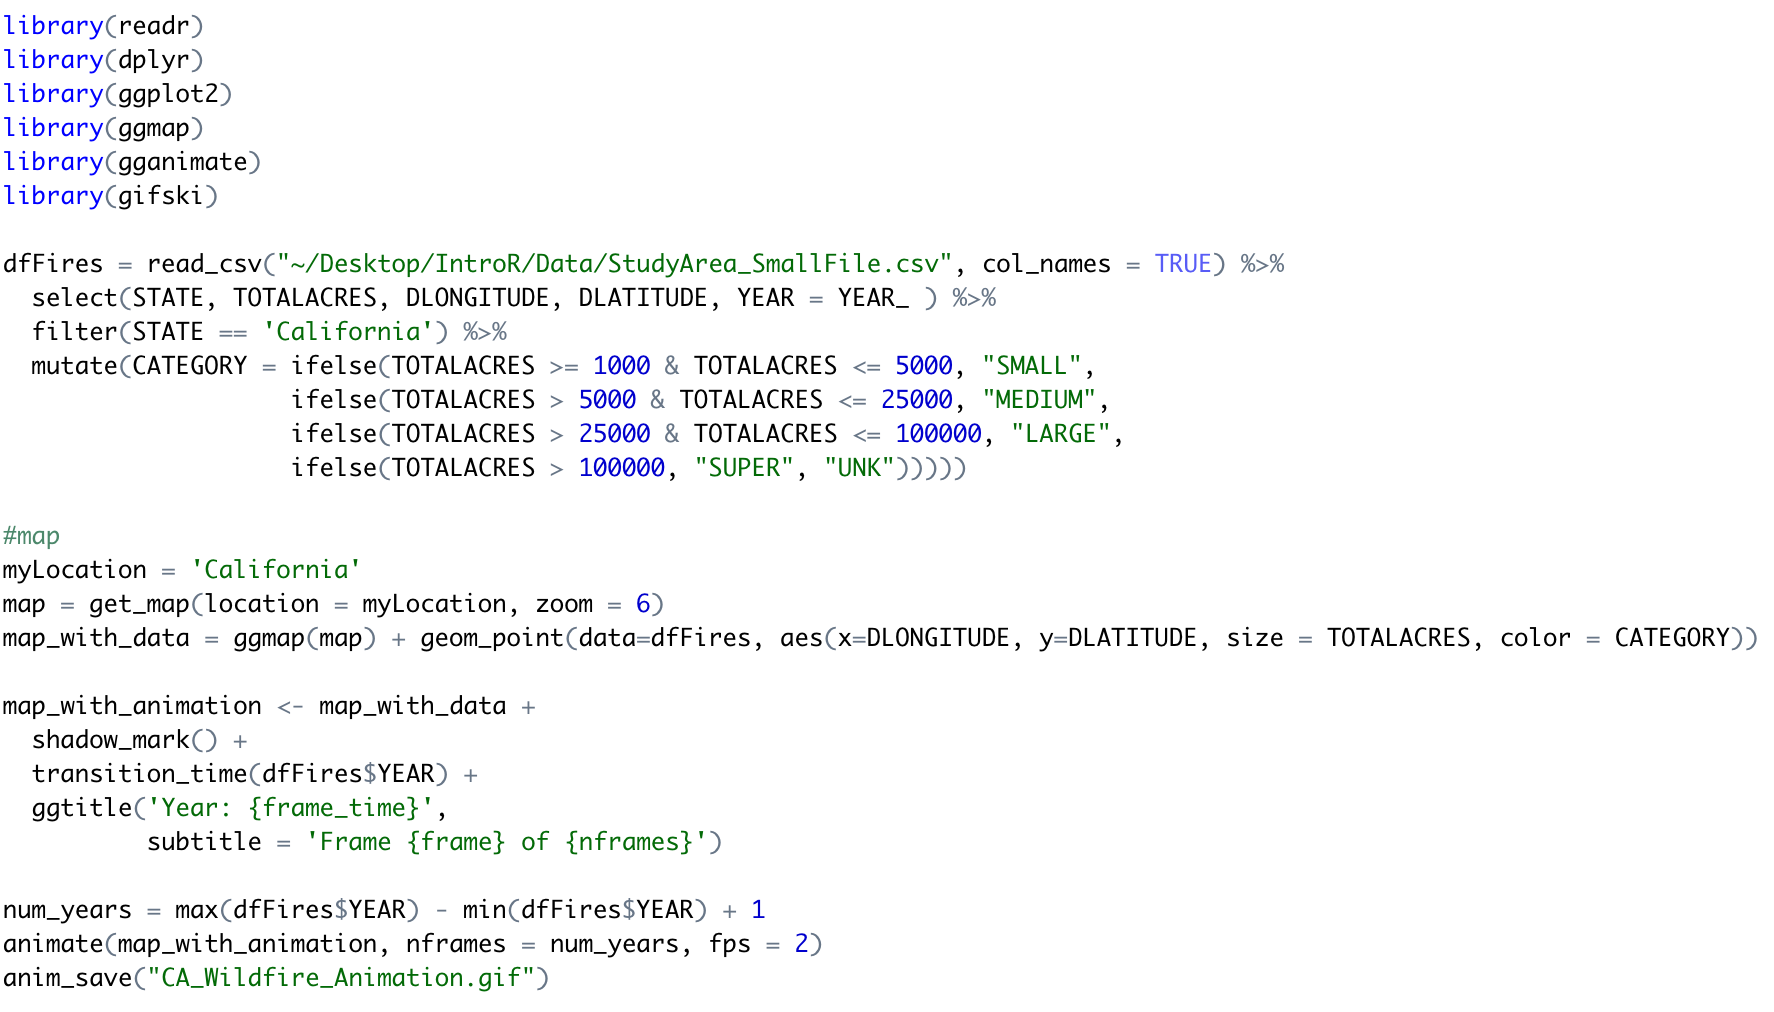
Below is the full text of the script. We’ll dissect it in sections below so you can better understand the code.
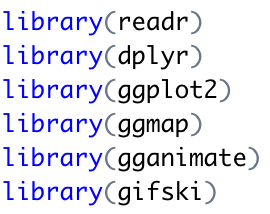
The first section simply loads the libraries that will be used. The readr, dplyr, and ggplot2 librraries are all part of the tidyverse ecosystem of packages. The ggmap library is tightly integrated with the ggplot2 library and will be used to create the basemap and overlay the wildfire data as points. Finally, the gganimate package is used to animate the display of the points on the map and gifski is used to create the final output gif displayed above.
The next section of the script reads a csv file containing wildfire data into a data frame object. Data frames are an R data structure that essentially act as in-memory tables. You can read more about data frames in this article.
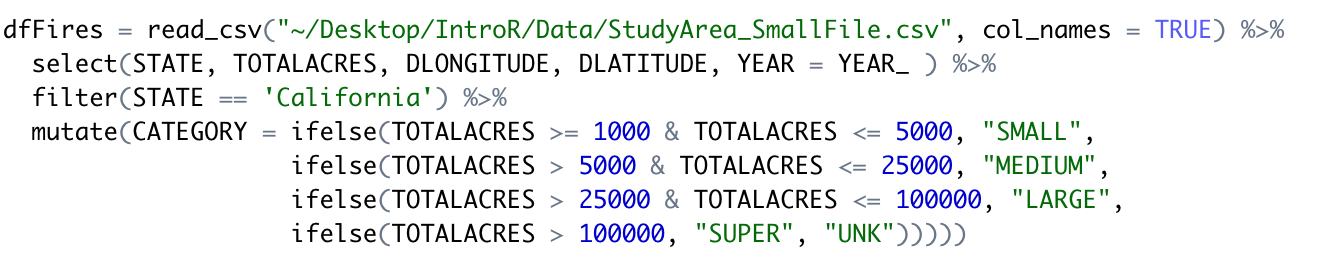
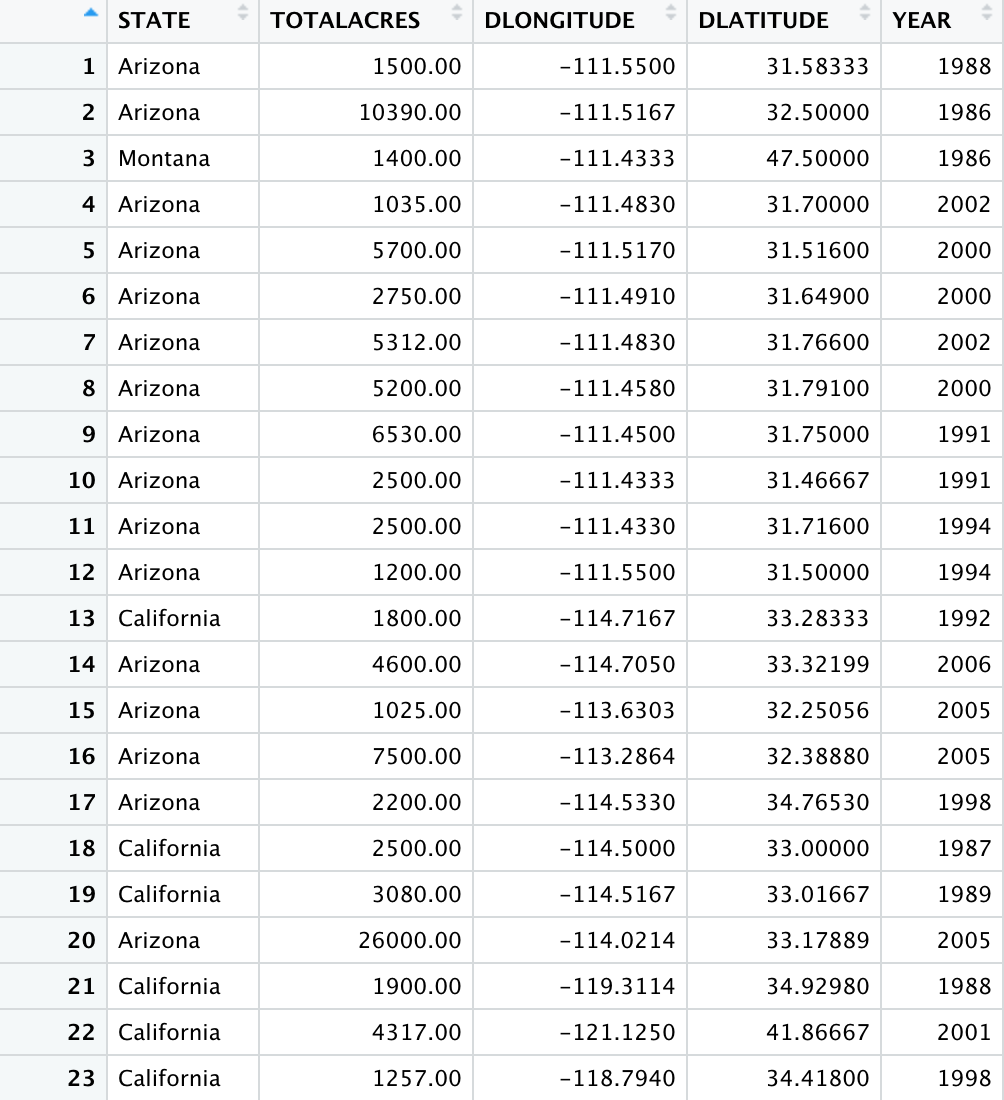
The data frame containing the contents of the StudyArea_SmallFiles.csv file is stored in a variable called dfFires. The dfFires variables is then passed to the select() function (part of the dplyr library), which is used to specify the columns that will be used in the mapping. At this point the dfFires data frame would appear as seen below if viewed in RStudio. Remember that a data frame is basically like an in-memory table of data.
Next, the filter() function (also from the dplyr library) is used to filter the data so that only wildfire data from California is preserved. Finally, we add a new column called CATEGORY used the dplyr mutate() function. The CATEGORY column is used to specify each fire as either SMALL, MEDIUM, LARGE, or SUPER based on the size of the fire.
The next section of code creates a basemap using the get_map() function from the ggmap (Google Maps) library, and uses the ggplot2 library to overlay the wildfire points (geom_point() function).

The geom_point() function is the key section of code used to overlay the wildfires on the Google Maps basemap. This function is passed the dfFires data frame and an aes() function containing the longitude (DLONGITUDE) and latitude (DLATITUDE) information for the x and y parameters. The size parameter, set to TOTALACRES, is used to create the graduated symbol size, and the color parameter, set to CATEGORY, creates a unique color for each wildfire category.
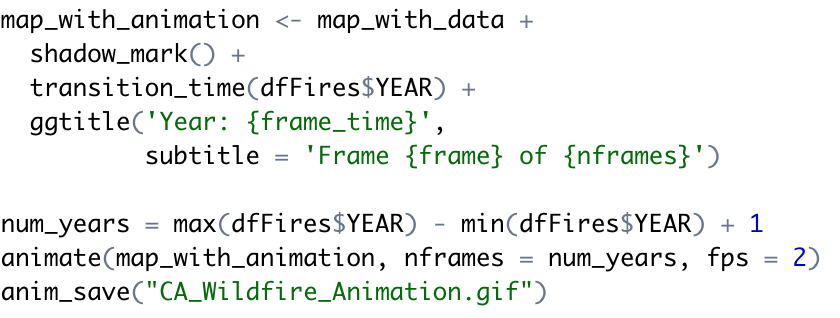
Finally, the gganimate library is used to animate the display of points by year (1980 – 2016). Here we define the transition time (in years), add a title and subtitle, animate the map, and save it to a gif.
Learn more about R in our Introduction to Data Visualization and Exploration with R class.
